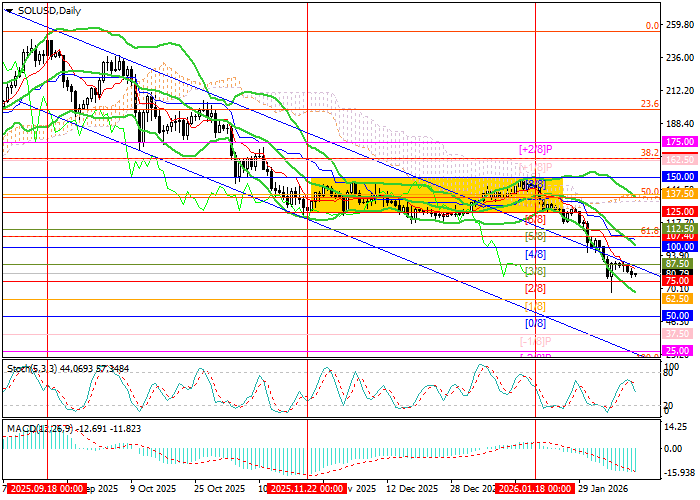
SOL/USD has resumed its decline within a long-term downtrend after an extended consolidation inside the 150.00–125.00 range and is now moving lower along its upper boundary. The price is approaching the 75.00 level (Murray [2/8]), which was unsuccessfully tested a week earlier. A confirmed break below this mark would open the way toward 50.00 (Murray [0/8]) and 25.00 (Murray [-2/8]). For bulls, the key resistance zone lies at 107.40–112.50 (Fibonacci 61.8% retracement, Murray [4/8], middle Bollinger Band). A breakout above this area would signal a stronger upside recovery toward 150.00 (Murray [8/8]) and 175.00 (Murray [+2/8]).
Technical indicators continue to favor the prevailing trend: Bollinger Bands and the Stochastic oscillator are turning downward, while the MACD histogram remains stable in negative territory. On the weekly chart, Bollinger Bands are still directed lower, and a completed “flag” pattern reinforces the dominance of bearish momentum.
Support and Resistance Levels
Resistance levels: 112.50, 150.00, 175.50.
Support levels: 75.00, 50.00, 25.00.
Trading Scenarios and SOL/USD Outlook
Short positions may be opened below 75.00 with targets at 50.00 and 25.00 and a stop-loss at 90.00. Timeframe: 5–7 days.
Long positions may be considered above 112.50 with targets at 150.00 and 175.50 and a stop-loss at 90.90.
Scenario
| Timeframe |
Weekly |
| Recommendation |
SELL STOP |
| Entry Point |
74.90 |
| Take Profit |
50.00, 25.00 |
| Stop Loss |
90.00 |
| Key Levels |
25.00, 50.00, 75.00, 112.50, 150.00, 175.50 |
Alternative Scenario
| Recommendation |
BUY STOP |
| Entry Point |
113.00 |
| Take Profit |
150.00, 175.50 |
| Stop Loss |
90.90 |
| Key Levels |
25.00, 50.00, 75.00, 112.50, 150.00, 175.50 |
cryptocurrency journalist and market analyst who has accumulated great experience. He shares practicable insight with traders, investors, and enthusiasts of the crypto world. John loves to explore the dynamic Web3 space, which involves blockchain technology or different coins besides decentralized applications (dApps) leading decentralized finance (DeFi), smart contracts or interoperability among blockchains, non-fungible tokens (NFTs), real-world assets (RWAs), and artificial intelligence combining blockchain. John has worked for leading cryptocurrency resources, among them FORECK.INFO, CoinGape, CryptoNews, and Business2Community