

At the same time, the U.S. dollar is finding support as analysts increasingly expect a pause in further Federal Reserve rate adjustments. January macroeconomic data pointed to labor market stabilization, with unemployment falling to 4.3% and nonfarm payrolls rising by 130.0K versus expectations of 66.0K. Inflation also slowed, with the headline CPI easing from 2.7% to 2.4% and the core index, excluding food and energy, declining from 2.6% to 2.5% year-over-year. However, inflation in several household-sensitive sectors remains well above the Fed’s 2.0% target. Minutes from the latest FOMC meeting showed no clear consensus among policymakers, but most officials remain concerned that upside inflation risks persist and believe borrowing costs should remain unchanged at least until midyear.
The token received some short-term support today after reports that the decentralized social platform Zora plans to migrate to the Solana blockchain. The project enables users to create so-called “attention markets” for trading tokens linked to internet trends: for 1.0 SOL, a user receives a token whose value is determined by the popularity of a specific topic on social media. Solana was chosen for its high transaction speed and low fees—key advantages for markets driven by short-lived momentum.
Overall, sentiment among crypto investors remains negative, reflected in continued outflows from digital exchange-traded products and the Crypto Fear & Greed Index staying deep in “extreme fear” territory at a reading of 9.
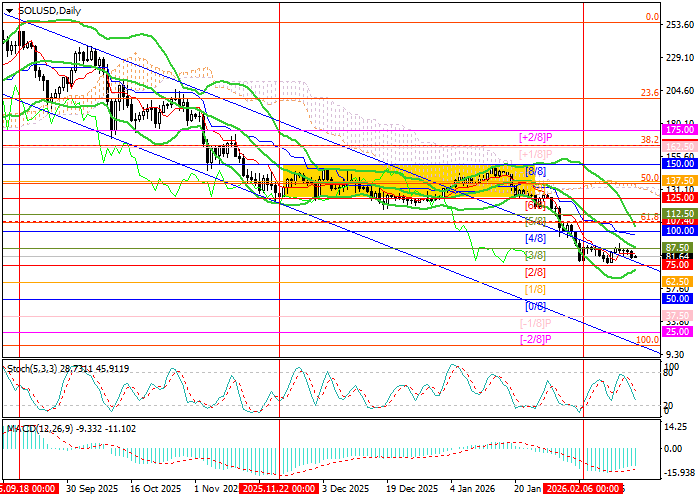
Support and resistance levels
Over the past two weeks, the instrument has been moving sideways within the 87.50–75.00 range (Murray levels [3/8]–[2/8]), although the long-term trend remains bearish. A downside breakout below 75.00 (Murray [2/8]) could open the way toward 50.00 (Murray [0/8]) and 25.00 (Murray [–2/8]). Conversely, a sustained move above the 107.40–112.50 resistance zone (61.8% Fibonacci retracement, Murray [5/8], and the Bollinger Bands’ midline) would signal a shift toward positive momentum, with upside targets at 150.00 (Murray [8/8]) and 175.00 (Murray [+2/8]).
Technical indicators continue to favor selling pressure: Bollinger Bands and the Stochastic oscillator are turning lower, while the MACD histogram remains firmly in negative territory.
Resistance levels: 112.50, 150.00, 175.50.
Support levels: 75.00, 50.00, 25.00.
Trading scenarios and SOL/USD outlook
Short positions can be considered below 75.00 with targets at 50.00 and 25.00, and a stop-loss at 90.00. Expected timeframe: 5–7 days.
Long positions can be considered above 112.50 with targets at 150.00 and 175.50, and a stop-loss at 90.90.
Scenario
| Timeframe | Weekly |
| Recommendation | SELL STOP |
| Entry point | 74.00 |
| Take Profit | 50.00, 25.00 |
| Stop Loss | 90.00 |
| Key levels | 25.00, 50.00, 75.00, 112.50, 150.00, 175.50 |
Alternative scenario
| Recommendation | BUY STOP |
| Entry point | 113.00 |
| Take Profit | 150.00, 175.50 |
| Stop Loss | 90.90 |
| Key levels | 25.00, 50.00, 75.00, 112.50, 150.00, 175.50 |
