
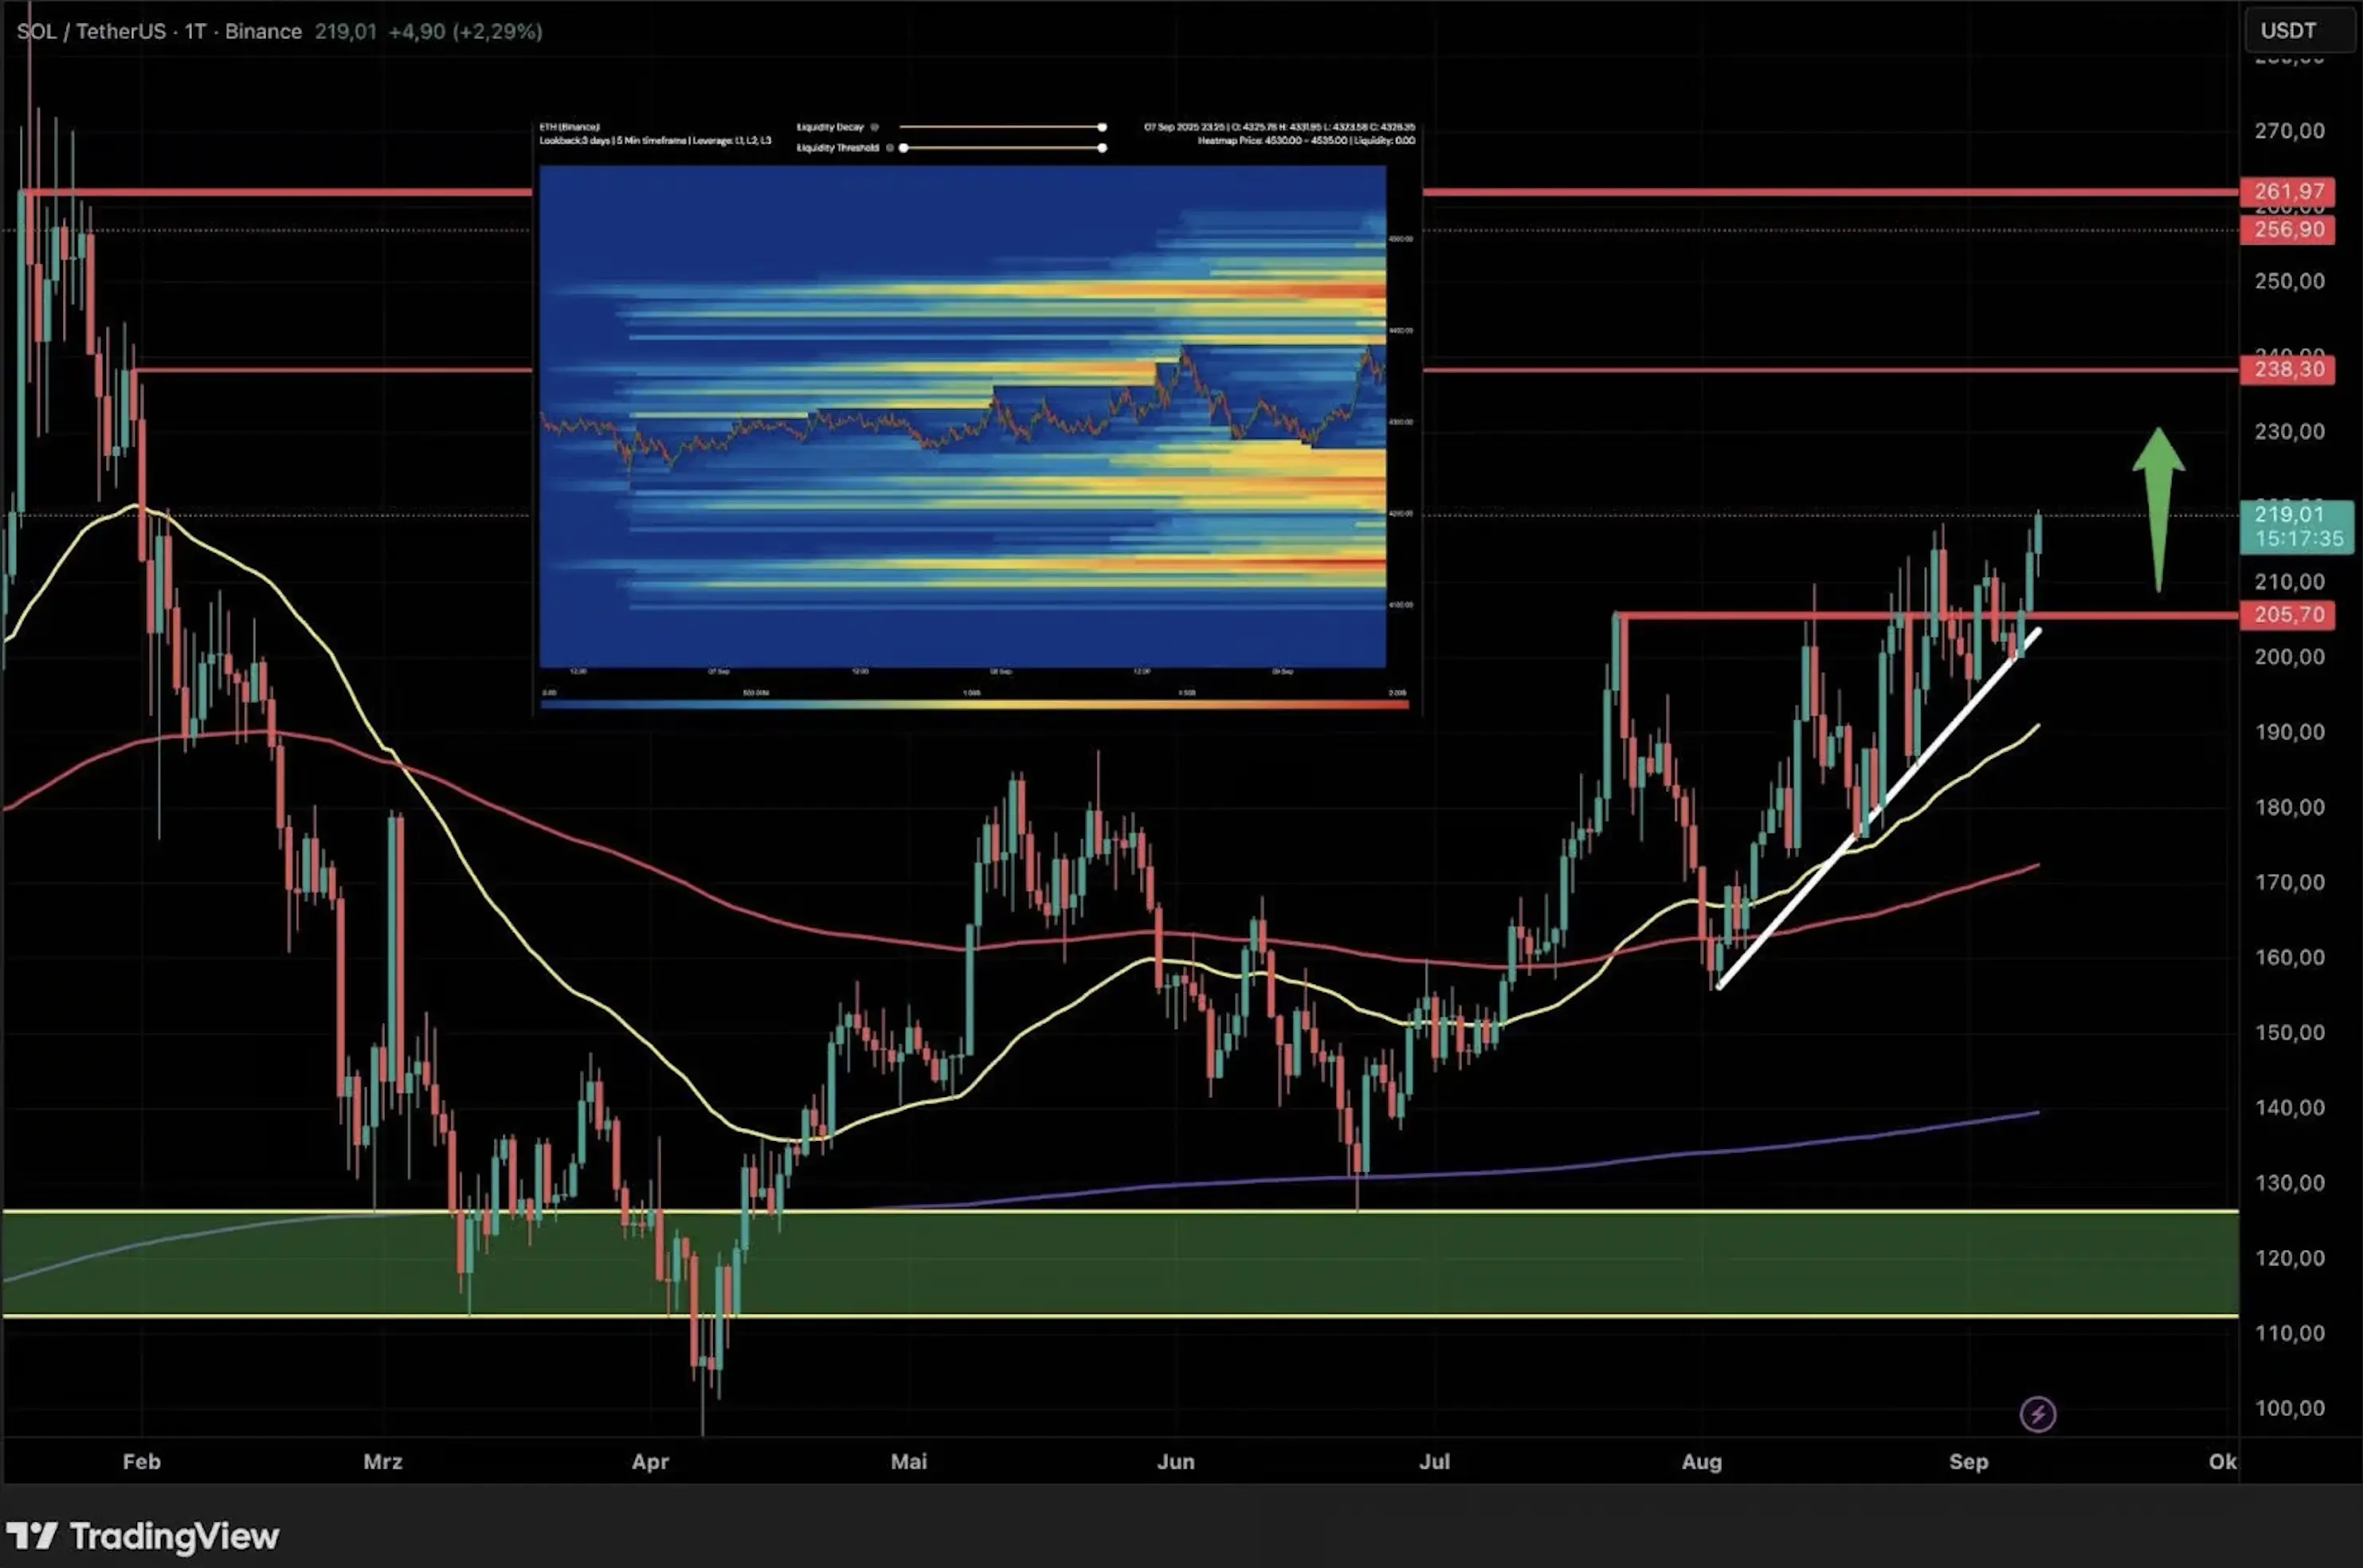
On the daily chart, the picture remains mostly positive: the price has confidently broken through an important resistance level and updated the local high. This gave a clear bullish signal. The Heatmap shows clusters of liquidity above the current levels, which could serve as fuel for a move toward the next target at $238.
However, much depends on Bitcoin’s behavior. If the leading cryptocurrency manages to consolidate above its own resistance barriers, Solana could receive a strong growth impulse. Conversely, if BTC corrects downward, SOL’s upward momentum may pause and shift into short-term consolidation.
The key support is currently located around $205. This level recently flipped from resistance into support and now serves as a critical threshold for buyers. As long as it holds, the overall bullish outlook remains intact. A breakdown below it, however, would significantly weaken the technical picture and increase the risk of a deeper correction.
Short-Term Outlook: Possible Correction
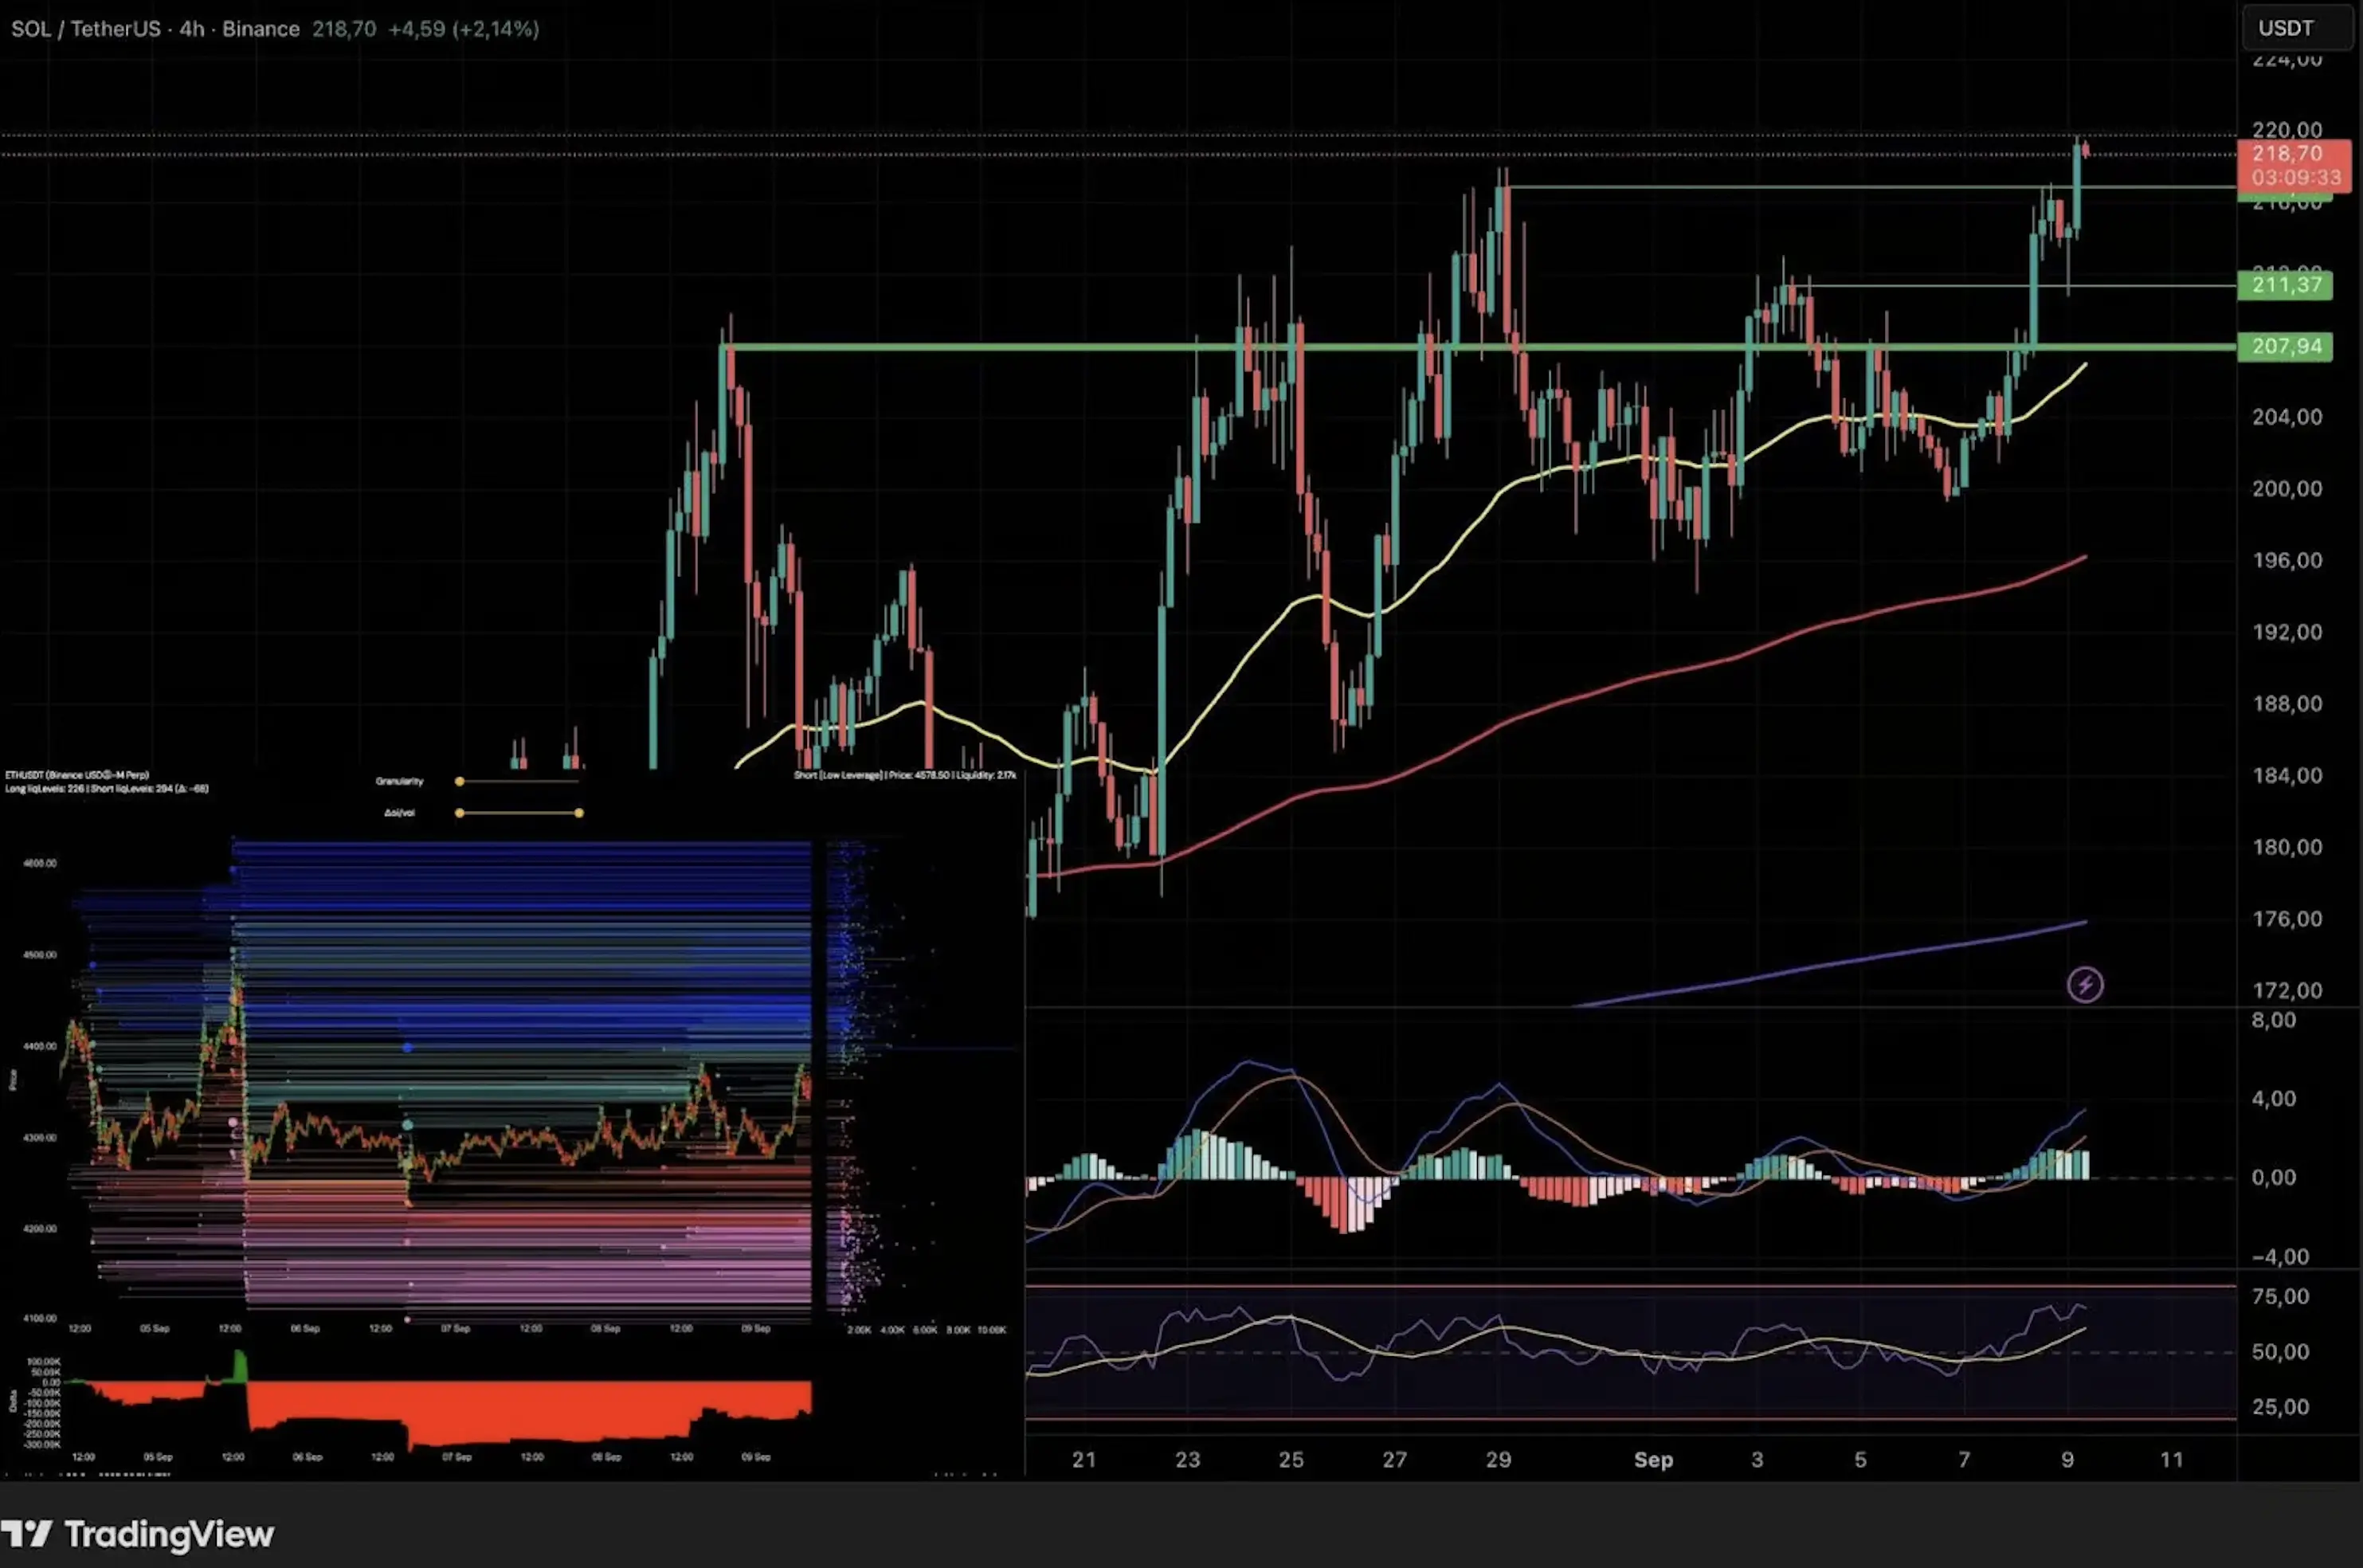
On the 4-hour chart, short positions clearly dominate, as reflected in the Short Delta indicator. The MACD points to weakening momentum, while the RSI has moved into the overbought zone. This combination suggests the possibility of a local correction needed to “reset” the indicators.
The $211.37 level is of particular interest, where a long candlestick wick recently formed and demand quickly absorbed the dip. If this level is tested again and fails to hold, the next barrier will be the 50 EMA zone, which has repeatedly acted as reliable support.
Thus, in the short term, Solana may enter a correction, but in the medium term the structure remains bullish as long as key support levels continue to hold.