

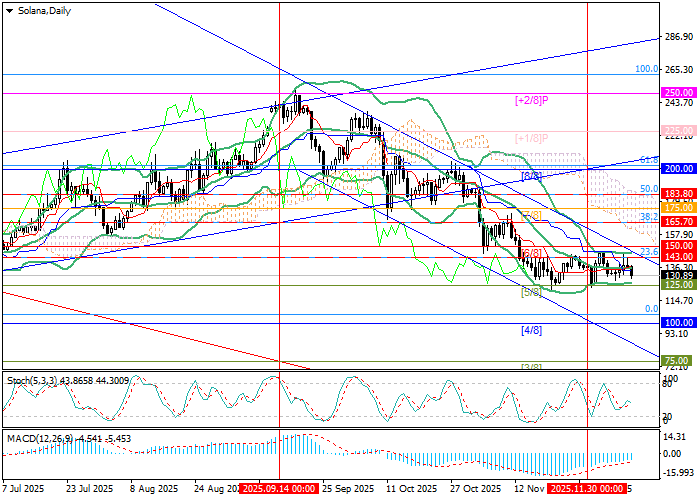
If the price consolidates below 125.00, the downtrend may resume toward 100.00 (Murray level [4/8]) and 75.00 (Murray level [3/8]). The key resistance zone for bulls is seen at 150.00–143.00 (Murray level [6/8], 23.6% Fibonacci retracement): a breakout above this area may push the pair out of the descending channel through its upper boundary and extend the rally toward 183.80 (50.0% Fibonacci retracement), 200.00 (Murray level [8/8], 61.8% Fibonacci retracement), and 225.00 (Murray level [+1/8]).
Technical indicators are not sending a unified signal: Bollinger Bands are flat, MACD is stable in negative territory, and Stochastic is attempting to turn downward.
It is also worth noting that on the weekly chart SOL/USD continues to show signs of forming a “double top” pattern, which supports the potential for further decline toward 93.75 (Murray level [3/8], W1).
Support and resistance levels
Resistance levels: 150.00, 183.80, 200.00, 225.00.
Support levels: 125.00, 100.00, 75.00.
Trading scenarios
Short positions are preferable below 125.00 with targets at 100.00 and 75.00 and a stop-loss at 142.90. Implementation horizon: 5–7 days.
Long positions may be opened above 150.00 with targets at 183.80, 200.00, and 225.00 and a stop-loss at 130.00.
