

Investors and forex traders are losing interest in risk assets amid escalating tensions between the US and the EU. US President Donald Trump announced a 10.0% tariff increase from February 1 against six European countries opposing the annexation of Greenland. In response, Brussels is preparing tariffs on US goods supplied to the eurozone worth up to €93.0 billion, as well as broader restrictions on US companies’ access to European markets. If implemented, these measures could significantly pressure global trade and the world economy, pushing market participants toward traditional safe-haven assets, primarily gold.
Additional pressure on BTC/USD comes from difficulties surrounding approval in the US Senate of the Crypto Market Structure and Transparency Act (CLARITY). The vote, initially scheduled for January 15, was postponed following criticism from influential members of the crypto community. In particular, Coinbase opposed the bill, arguing that in its current form it would effectively ban tokenized securities. It later emerged that leaders of the Senate Judiciary Committee from both parties called for amendments to tighten oversight of money transmission companies, warning that otherwise the law could be exploited by fraudsters. The prospect of stricter regulation is weighing on sentiment across the crypto market and intensifying digital asset sell-offs.
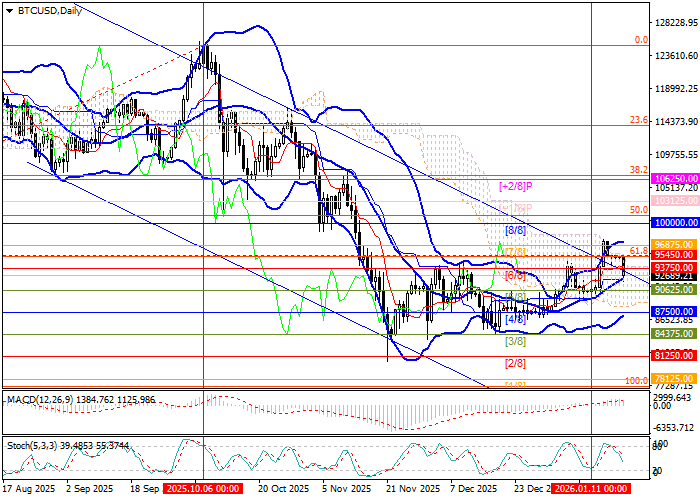
Support and Resistance Levels
The instrument is attempting to return to the descending channel it recently broke above. If the midline of the Bollinger Bands and the 90,625.00 level (Murray [5/8]) are broken to the downside, the decline could extend toward 84,375.00 (Murray [3/8]) and 81,250.00 (Murray [2/8]). For bulls, the key level is 96,875.00 (Murray [7/8]): a firm breakout above it could trigger growth toward 100,000.00 (Murray [8/8]) and 106,250.00 (Murray [+2/8], Fibonacci retracement 38.2%).
Technical indicators provide mixed signals: Bollinger Bands are turning upward, MACD remains stable in positive territory, while the Stochastic oscillator is pointing downward.
Resistance levels: 96,875.00, 100,000.00, 106,250.00.
Support levels: 90,625.00, 84,375.00, 81,250.00.
Trading Scenarios
Short positions may be opened below 90,625.00 with targets at 84,375.00 and 81,250.00, and a stop-loss at 93,800.00. Time horizon: 5–7 days.
Long positions may be opened above 96,875.00 with targets at 100,000.00 and 106,250.00, and a stop-loss at 93,900.00.
Scenario
| Timeframe | Weekly |
| Recommendation | SELL STOP |
| Entry point | 90,600.00 |
| Take Profit | 84,375.00, 81,250.00 |
| Stop Loss | 93,800.00 |
| Key levels | 81,250.00, 84,375.00, 90,625.00, 96,875.00, 100,000.00, 106,250.00 |
Alternative Scenario
| Recommendation | BUY STOP |
| Entry point | 96,900.00 |
| Take Profit | 100,000.00, 106,250.00 |
| Stop Loss | 93,900.00 |
| Key levels | 81,250.00, 84,375.00, 90,625.00, 96,875.00, 100,000.00, 106,250.00 |
