

After a soft start to the month, Bitcoin bounced hard and, riding the tailwind from the Nasdaq-100, ripped to a new all-time high at $124,533. Profit-taking then hit, dragging price back to about $118,204, slipping below the key $120,000 threshold. Which levels must BTC reclaim to keep the uptrend intact—and which supports can’t afford to break?
👀#PPI #Inflation
— Stefan Luebeck (@CryptoEva) August 14, 2025
*US JULY PRODUCER PRICES RISE 3.3% Y/Y; EST. +2.5%
*US JULY PRODUCER PRICES RISE 0.9% M/M; EST. +0.2%
*US JULY CORE PPI RISES 0.9% M/M; EST. +0.2%
*US JULY CORE PPI RISES 3.7% Y/Y; EST. +2.9%
What’s in Play Now
Bitcoin vaulted above $119,926 and briefly set a new high. But worse-than-expected U.S. PPI data in the early afternoon knocked BTC down toward a confluence of supports: the 20-day EMA (EMA20, red) and a horizontal shelf near $117,400, where buyers stepped in. Roughly $100M in leveraged longs were liquidated within minutes; from the morning peak, BTC slid more than 5% before stabilizing. Volatility is clearly back.
The good news: BTC defended the EMA20 and reclaimed the EMA9 (green), which has acted as a sturdy bid for a week. Near term, bulls need a decisive close above $120,113 to re-engage the blue resistance band at $122,783–$123,568. A daily close below $117,462, by contrast, would put the $116,000 area back in play and increase the odds of a retest of the broken downtrend channel from above.
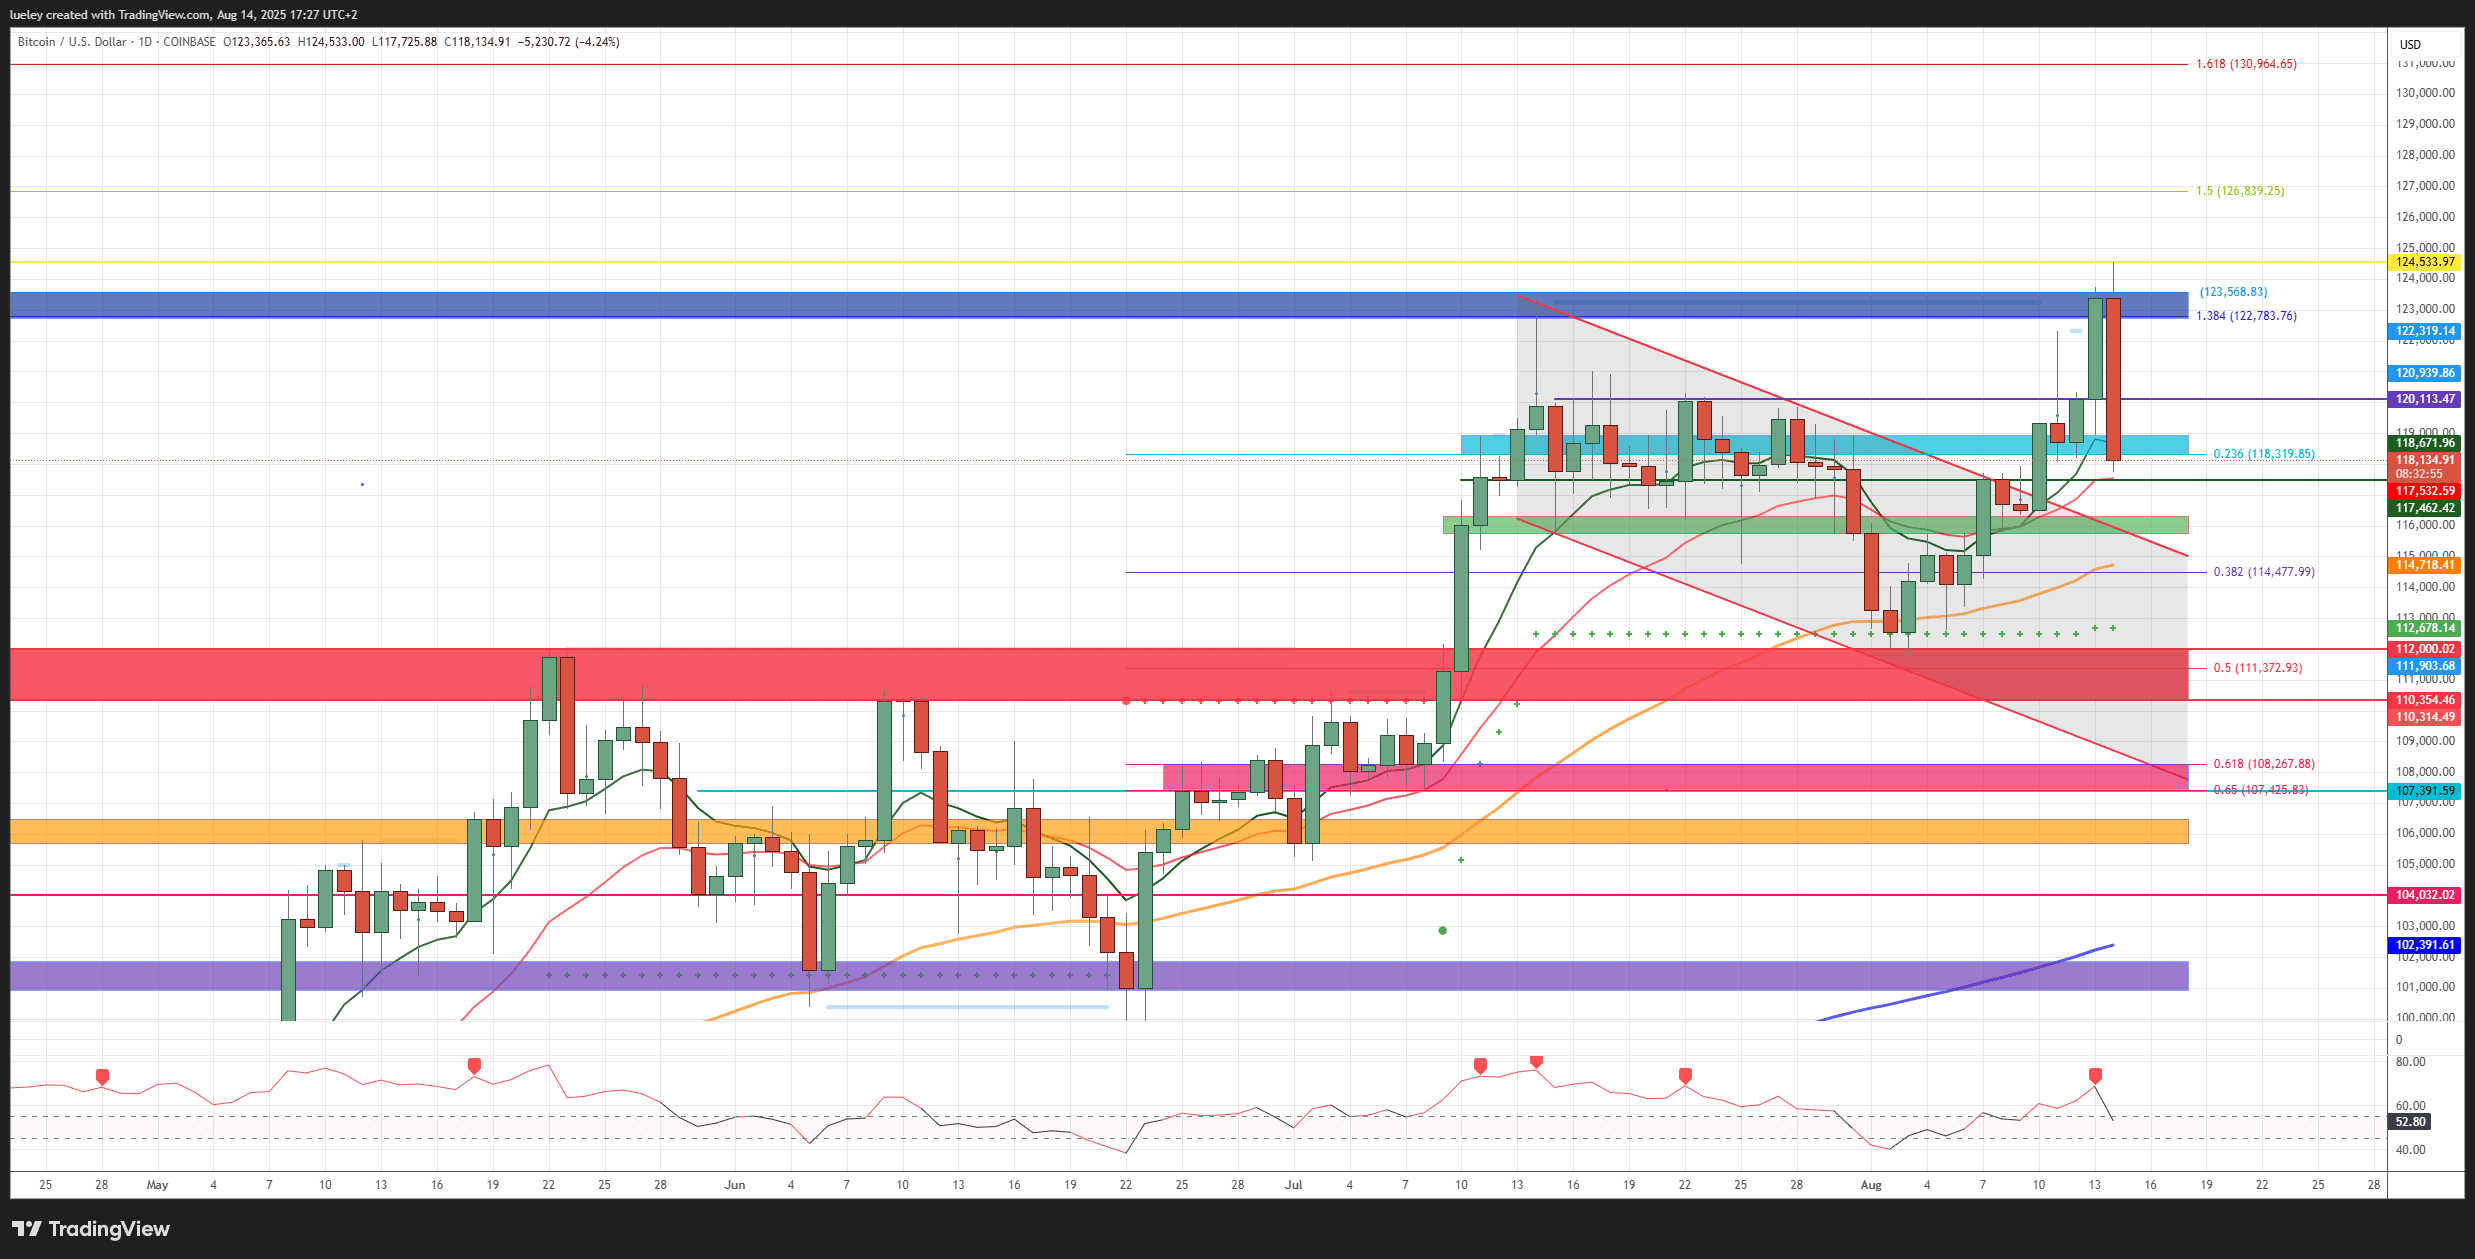
(Chart context: BTC/USD on Coinbase, with support/resistance zones, trendlines, Fibonacci levels, moving averages, and RSI.)
Bullish Targets (Next Few Weeks)
Key upside levels:
- $118,319 / $118,932 (stabilization/turquoise zone)
- $120,113 (must reclaim)
- $122,783 / $123,568 (make-or-break resistance band)
- $124,533 (ATH)
- $126,839 (150% Fibonacci projection)
- $130,964 (161% Fibonacci extension; medium-term target)
Price action has been whipsawing. After the breakout above $120K, BTC tagged $124,533, then slipped back under the blue zone and flushed toward $118K. That drop temporarily negated the last two sessions’ breakout. Bulls now need to hold $117,462 to keep the structure intact. A brief intraday spike to $116,322–$115,769 could be absorbed, but deeper would dent momentum.
For a credible retest of the highs, BTC should base in $118,325–$118,932 (turquoise zone), flip $120,113 to support, and then attack $122,783–$123,568. Only multiple daily closes above that band would clear the path back to $124,533 and onward to $126,839. With supportive headlines—especially from the U.S.—BTC could stretch toward $130,964 into the next Fed rate decision (in 34 days).
Bearish Scenarios (Next Few Weeks)
Key downside levels:
- $117,462 (decision point)
- $116,322 / $115,769 (green zone / top of broken channel)
- $114,477 (38% retracement)
- $112,067 / $110,300
- $108,267 / $107,425 (Golden Pocket)
- $106,472 / $105,697 (last-ditch area)
Bears reappeared on the PPI surprise, knocking BTC into the EMA20. While price has steadied, any daily close below the turquoise band—and especially below $120,113—keeps consolidation risk elevated. Sentiment also soured after U.S. Treasury Secretary Scott Bessent said Washington won’t buy BTC for a state reserve (relying only on seized coins), a headline that may lean bearish.
Lose EMA9 and the 23% retracement at the lower edge of the turquoise band, and $117,462 becomes the first line in the sand. A break opens $116,322–$115,769 (tested multiple times in July and aligned with the broken channel’s top). Failure there invites a drive to EMA50 and $114,477; stall again and a visit to the $112K area looms (the Supertrend near $112,684 may be a last stand).
If sellers push through the 50% retracement and $110,300, the odds of a test of the channel’s lower boundary rise. The Golden Pocket at $108,267–$107,425—a strong support early last month—marks the maximum pullback for now, though a brief spike toward $106,853–$105,697 can’t be ruled out. Given rising odds of a U.S. rate cut in the near term, a clean break below that zone looks less likely.
Indicators Check
- 4H RSI: flirting with a sell signal unless it quickly returns to neutral.
- Daily RSI: back to neutral after today’s drop; stabilizing here would leave room for another breakout attempt.
- Weekly RSI: showing early fatigue—no fresh RSI high versus price ATH—but still above neutral, suggesting cooling, not necessarily a trend break.
Previously, FORECK.INFO reported on the White House exploring “budget-neutral” ways to expand federal Bitcoin holdings—making today’s Treasury stance that it “won’t buy Bitcoin” a sharp contrast.
Disclaimer: The price levels and scenarios discussed are an analyst’s view, not financial advice. Do your own research
