

On Saturday, tensions between the United States and Iran escalated into an openly militarized conflict, significantly increasing the risk of a global economic slowdown due to rising hydrocarbon prices. Brent Crude Oil has already reached two-year highs near $80.00 per barrel following the effective closure of the Strait of Hormuz, although the region’s energy infrastructure has not yet suffered major damage. Against this backdrop, investors are reallocating capital from riskier digital assets into precious metals. Asian equity markets opened the week lower, and a similar dynamic is likely in the United States, adding further pressure to the crypto sector.
The confrontation in the Persian Gulf has also intensified uncertainty around US Federal Reserve monetary policy. Higher oil prices directly fuel inflation expectations, potentially forcing the Fed to keep interest rates elevated for longer or even consider further tightening to contain consumer price growth. At the same time, a number of experts, including BitMEX co-founder Arthur Hayes, argue that if the US–Iran conflict drags on excessively, the regulator may resort to expanding the money supply to support the administration. Hayes noted that every US president since 1985 has initiated military action in the Middle East, and each time financial authorities responded by easing credit conditions. However, with no clear consensus between President Donald Trump and Federal Reserve officials on the future policy path, the extent of institutional support for foreign policy initiatives remains uncertain.
Overall sentiment in the cryptocurrency market remains negative. Last week, Bitcoin ETFs recorded inflows of $787.4 million, but the broader trend continues to point downward. According to analytics platform SoSoValue, digital BTC-based funds have seen cumulative outflows of $6.39 billion over the past four months — the longest losing streak since the product’s launch. Meanwhile, the Crypto Fear & Greed Index, which had edged slightly higher last week, has fallen back to the “10” level, firmly within the zone of extreme fear.
As a result, the fundamental backdrop continues to favor further downside in the BTC/USD pair over the medium term.
Support and resistance levels
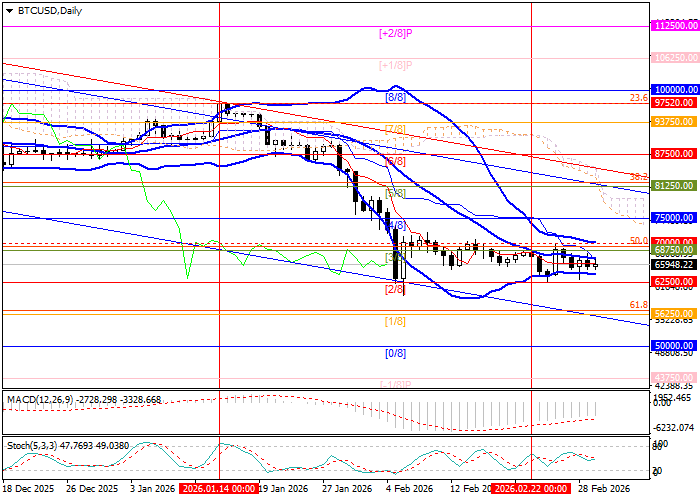
The instrument is moving toward the lower boundary of the trading range at 62,500.00 (Murray level [2/8]). A break below this level would open the way toward 56,250.00 (Murray level [1/8], 61.8% Fibonacci retracement) and 50,000.00 (Murray level [0/8]). Conversely, a sustained move above the upper Bollinger Band at 70,000.00 would signal a resumption of corrective growth toward 81,250.00 (Murray level [5/8], 38.2% Fibonacci retracement) and 93,750.00 (Murray level [7/8]).
Technical indicators provide mixed signals: Bollinger Bands and the Stochastic Oscillator have shifted into a sideways mode, while the MACD histogram remains stable in negative territory.
Resistance levels: 70,000.00, 81,250.00, 93,750.00.
Support levels: 62,500.00, 56,250.00, 50,000.00.
Trading scenarios and BTC price outlook
Short positions can be opened below 62,500.00 with targets at 56,250.00 and 50,000.00, and a stop-loss at 67,000.00. Time horizon: 5–7 days.
Long positions can be opened above 70,000.00 with targets at 81,250.00 and 93,750.00, and a stop-loss at 64,000.00.
Scenario
| Timeframe | Weekly |
| Recommendation | SELL STOP |
| Entry point | 62,200.00 |
| Take Profit | 56,250.00, 50,000.00 |
| Stop Loss | 67,000.00 |
| Key levels | 50,000.00, 56,250.00, 62,500.00, 70,000.00, 81,250.00, 93,750.00 |
Alternative scenario
| Recommendation | BUY STOP |
| Entry point | 70,200.00 |
| Take Profit | 81,250.00, 93,750.00 |
| Stop Loss | 64,000.00 |
| Key levels | 50,000.00, 56,250.00, 62,500.00, 70,000.00, 81,250.00, 93,750.00 |
