

Over the weekend, oil-producing countries agreed to increase production by 137,000 barrels per day — matching October levels and falling well below analyst expectations. Before the summit, various sources had suggested possible hikes between 274,000 and 411,000 barrels per day to help the cartel and its allies regain lost market share. However, members appeared cautious, likely wary of oversupplying the market or failing to meet quotas due to limited production capacity. Following the meeting, Russian Deputy Prime Minister Alexander Novak stated that OPEC+ did not discuss quota adjustments beyond November, noting that output levels had already been revised by 2.7 million barrels per day this year.
Additional price support came from the World Bank’s upgraded forecast for China’s economic growth — from 4.0% to 4.8% — despite global trade uncertainty. This points to a likely rebound in energy demand from the world’s top importer. However, the current upward movement appears fragile amid political and economic uncertainty in the U.S. Weak September employment data from Automatic Data Processing (ADP) signaled further cooling in the national economy, which could weigh on global oil consumption going forward.
Support and resistance levels
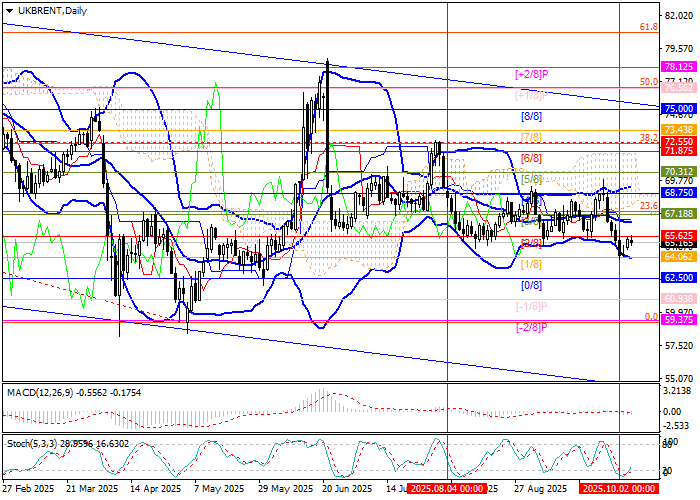
The price remains close to 64.06 (Murray level [1/8]), which was tested last week. A breakout below this level would open the way to 60.93 (Murray level [–1/8]) and 59.37 (Murray level [–2/8]). For the bulls, the key level is 67.18 (Murray level [3/8], 23.6% Fibonacci retracement, middle Bollinger band). A breakout above it would allow the uptrend to extend toward 70.31 (Murray level [5/8]) and 72.55 (38.2% Fibonacci retracement).
Technical indicators confirm the prevailing bearish trend: Bollinger Bands are turning lower, MACD is expanding in the negative zone, while Stochastic is preparing to exit oversold territory — suggesting a possible short-term rebound.
Resistance levels: 67.18, 70.31, 72.55.
Support levels: 64.06, 60.93, 59.37.
Trading scenarios and Brent crude oil forecast
Short positions can be opened below 64.06 with targets at 60.93 and 59.37, stop-loss at 65.20. Implementation period: 5–7 days.
Long positions can be opened above 67.18 with targets at 70.31 and 72.55, stop-loss at 65.50.
Scenario
| Timeframe | Weekly |
| Recommendation | SELL STOP |
| Entry point | 64.05 |
| Take Profit | 60.93, 59.37 |
| Stop Loss | 65.20 |
| Key levels | 59.37, 60.93, 64.06, 67.18, 70.31, 72.55 |
Alternative scenario
| Recommendation | BUY STOP |
| Entry point | 67.20 |
| Take Profit | 70.31, 72.55 |
| Stop Loss | 65.50 |
| Key levels | 59.37, 60.93, 64.06, 67.18, 70.31, 72.55 |