

Persistent geopolitical tensions and ongoing military conflicts in the Middle East and Eastern Europe are pushing many governments to increase their defense budgets. This is driving a rise in the volume of orders for RTX Corp. and keeping investor interest in its stock elevated. Against this backdrop, the company’s share price has gained more than 47.0% over the past year, while its market capitalization has reached roughly 230.0 billion US dollars. Recently, management secured two major contracts: one with Israel for the supply of interceptor missiles for the Iron Dome missile defense system worth 1.25 billion US dollars, and another with the US Department of Defense for F-35 engine maintenance — a deal expected to generate 1.61 billion US dollars in revenue for Pratt & Whitney, an RTX Corp. subsidiary, through the end of 2026.
According to the company’s financial results, adjusted earnings per share (EPS) in the third quarter came in at 1.70 US dollars, beating the consensus estimate of 1.42 US dollars by 19.7%. Net income rose 17.2% year-over-year to 1.45 US dollars per share, while revenue reached 22.48 billion US dollars, 4.6% above expectations of 21.48 billion US dollars.
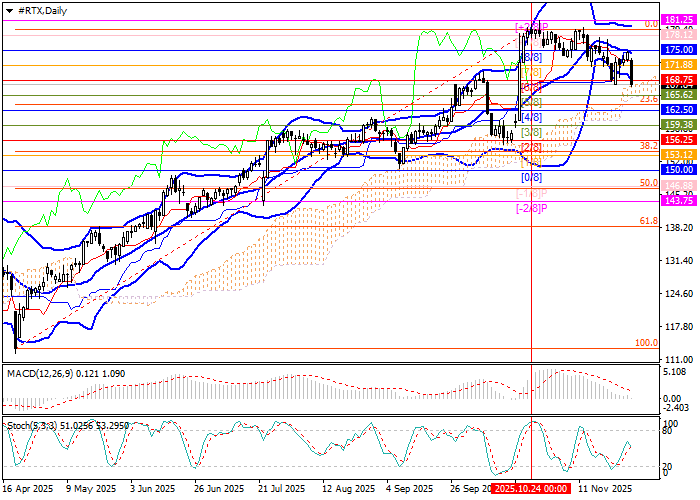
Support and resistance levels
The stock is pulling back from its yearly highs and attempting to consolidate below 168.75 (Murray level [6/8]). If this breakout is confirmed, the decline could extend toward 162.50 (Murray level [4/8]) and 156.25 (Murray level [2/8]). Conversely, if the price breaks back above 175.00 (Murray level [8/8]) — reinforced by the middle line of the Bollinger Bands — the upward move may resume toward 181.25 (Murray level [+2/8]) and 187.50 (Murray level [7/8], W1).
Technical indicators allow for further corrective downside: the Bollinger Bands and Stochastic are turning upward, while MACD remains stable in positive territory.
Resistance levels: 175.00, 181.25, 187.50.
Support levels: 162.50, 156.25.
Trading scenarios and RTX stock forecast
Short positions can be considered from 167.50 with targets at 162.50 and 156.25 and a stop-loss at 170.60. Implementation horizon: 5–7 days.
Long positions can be considered if the price consolidates above 175.00 with targets at 181.25 and 187.50 and a stop-loss at 170.20.
Base scenario
| Timeframe | Weekly |
| Recommendation | SELL STOP |
| Entry point | 167.45 |
| Take Profit | 162.50, 156.25 |
| Stop Loss | 170.60 |
| Key levels | 156.25, 162.50, 175.00, 181.25, 187.50 |
Alternative scenario
| Recommendation | BUY STOP |
| Entry point | 175.05 |
| Take Profit | 181.25, 187.50 |
| Stop Loss | 170.20 |
| Key levels | 156.25, 162.50, 175.00, 181.25, 187.50 |
