

In particular, the cost of Russian oil supplies for Chinese buyers continues to decline. While discounts previously applied mainly to the Urals grade, Bloomberg analysts now point to a record year-to-date discount on ESPO crude. Last week, during shipments from the Kozmino port, the discount reached 7.0–8.0 dollars per barrel. Analysts cite US sanctions targeting key buyers of Russian energy as the main driver. Against this backdrop, Chinese state-owned refineries are seeking to limit risk by purchasing crude either at deeply discounted prices or indirectly through private refiners, which then distribute supplies across the sector. Despite the restrictions, China is maintaining a high level of seaborne imports of Russian crude. According to preliminary data from Kpler SAS, imports in December are expected to rise to 1.35 million barrels per day, up 10.0% month-on-month.
At 11:30 PM GMT+2, investors will turn their attention to fuel inventory data from the American Petroleum Institute (API). Preliminary estimates suggest that inventories will continue to decline following last week’s drawdown of 4.8 million barrels. Tomorrow, at 5:30 PM GMT+2, the US Energy Information Administration (EIA) will publish its weekly report. After a reduction of 1.812 million barrels last week, analysts expect another decline of around 1.5 million barrels. Overall, experts anticipate that the downward trend will persist, as newly accessible markets—partly enabled by measures affecting Russian supply—are increasing purchase volumes. Meanwhile, investment demand is gradually improving: during Friday’s session on the Chicago Mercantile Exchange (CME Group), open interest reached 876,000 futures positions, above the early-month average of around 700,000 contracts.
Support and resistance levels
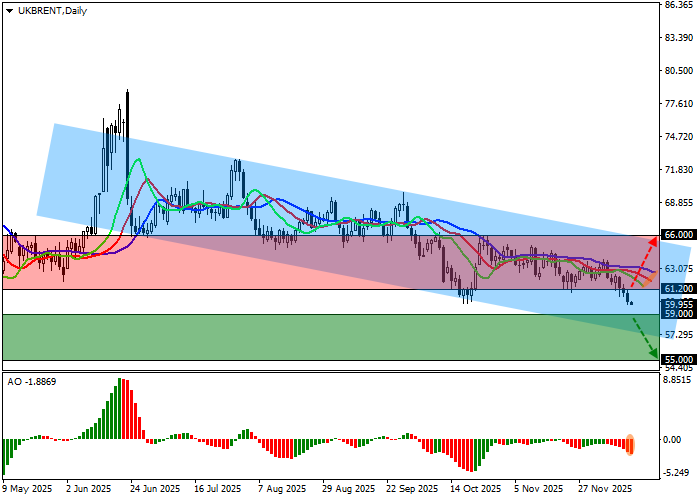
On the daily chart, the instrument is approaching the support line of a descending channel with dynamic boundaries between 66.00 and 57.00, within the current corrective wave.
Technical indicators are reinforcing a sell signal. The fast EMAs of the Alligator indicator remain below the signal line and continue to diverge from it, while the Awesome Oscillator histogram is forming corrective bars in negative territory.
Resistance levels: 61.20, 66.00.
Support levels: 59.00, 55.00.
Trading scenarios and oil price outlook
Short positions may be opened after the price declines and consolidates below 59.00, with a target at 55.00. Stop-loss: 61.00. Time horizon: 7 days or longer.
Long positions may be opened after the price rises and consolidates above 61.20, with a target at 66.00. Stop-loss: 60.00.
Scenario
| Timeframe | Weekly |
| Recommendation | SELL STOP |
| Entry point | 58.95 |
| Take Profit | 55.00 |
| Stop Loss | 61.00 |
| Key levels | 55.00, 59.00, 61.20, 66.00 |
Alternative scenario
| Recommendation | BUY STOP |
| Entry point | 61.25 |
| Take Profit | 66.00 |
| Stop Loss | 60.00 |
| Key levels | 55.00, 59.00, 61.20, 66.00 |
