

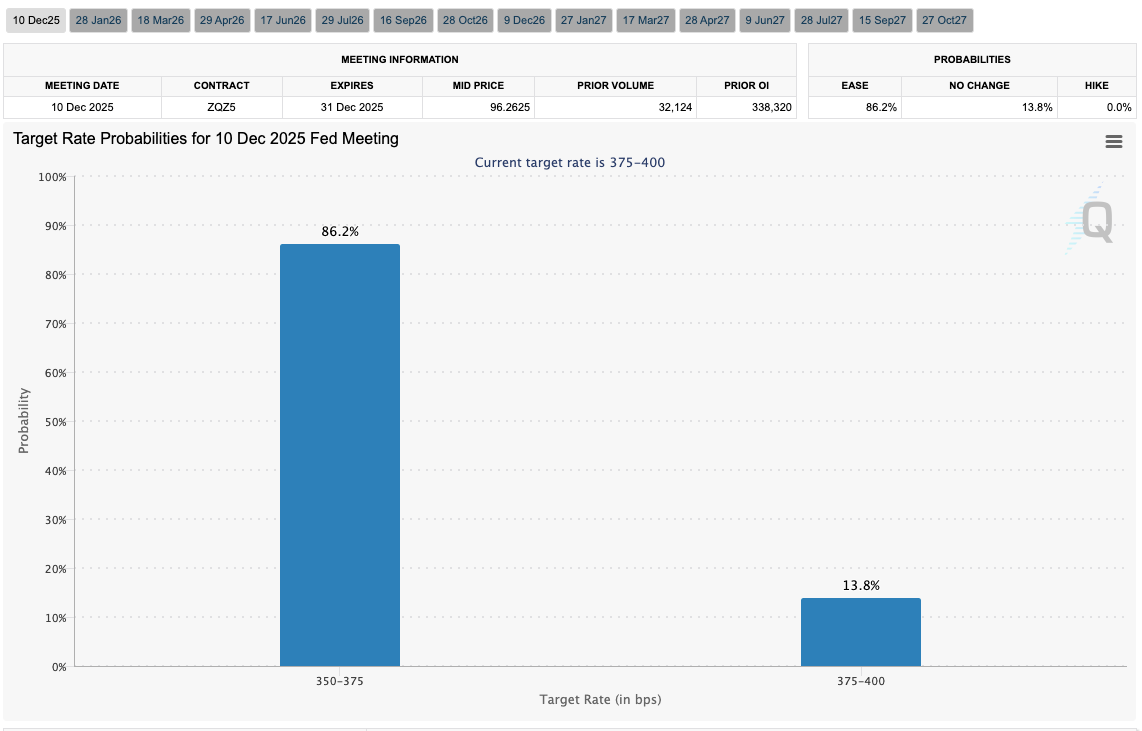
Not all policymakers on the Federal Open Market Committee (FOMC) share a dovish stance, even though Fed Chair Jerome Powell has repeatedly warned markets against unrealistic expectations regarding the pace of monetary easing. However, inflation continues to cool, while pressure on the regulator from the White House remains strong. On Friday, the University of Michigan published updated December forecasts: one-year inflation expectations dropped from 4.5% to 4.1%, while five-year expectations fell from 3.4% to 3.2%. Meanwhile, household income and spending data showed mixed results: incomes increased by 0.4% versus a preliminary estimate of 0.3%, while spending was revised down from 0.5% to 0.3%, which may further support the slowdown in price pressures.
The Bank of England may also announce borrowing cost reductions at its December 18 meeting, providing additional support for gold. Geopolitical risks also remain in focus: the Russia–Ukraine conflict continues, although recent weeks have seen U.S. attempts to push the parties toward a peace agreement that could significantly ease regional tensions. Analysts believe that after this, U.S. President Donald Trump may shift strategic focus to South America, where the likelihood of military operations remains.
Volatility in the precious metals market has once again declined. According to CME Group Inc., gold futures open interest totaled just 225.34 thousand contracts, while options stood at 67.07 thousand — well below the November averages of 310.5 thousand and 92.0 thousand, respectively. However, current values remain above the lows seen in the middle of last week due to modest capital inflows from the equity market, where earnings season has concluded.
Support and Resistance Levels
Bollinger Bands on the daily chart are steadily rising, while the price range is narrowing, indicating mixed trading sentiment in the very short term. MACD is declining, maintaining a weak sell signal (the histogram remains below the signal line). Stochastic displays similar dynamics, rapidly approaching oversold levels that indicate increasing short-term selling risks.
Resistance levels: 4,245.06, 4,300.00, 4,350.00, 4,400.00.
Support levels: 4,179.79, 4,120.00, 4,060.00, 4,000.00.
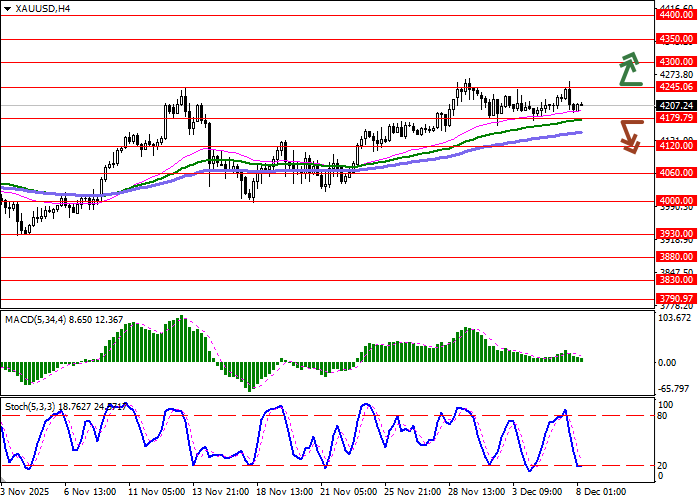
Trading Scenarios and XAU/USD Forecast
Short positions may be opened after a confident breakdown of 4,179.79 with a target of 4,060.00. Stop-loss — 4,245.06. Implementation period: 2–3 days.
A return to bullish momentum followed by a breakout above 4,245.06 may signal the opening of new long positions targeting 4,400.00. Stop-loss — 4,179.79.
Scenario
| Timeframe | Intraday |
| Recommendation | SELL STOP |
| Entry Point | 4,179.75 |
| Take Profit | 4,060.00 |
| Stop Loss | 4,245.06 |
| Key Levels | 4,000.00, 4,060.00, 4,120.00, 4,179.79, 4,245.06, 4,300.00, 4,350.00, 4,400.00 |
Alternative Scenario
| Recommendation | BUY STOP |
| Entry Point | 4,245.10 |
| Take Profit | 4,400.00 |
| Stop Loss | 4,179.79 |
| Key Levels | 4,000.00, 4,060.00, 4,120.00, 4,179.79, 4,245.06, 4,300.00, 4,350.00, 4,400.00 |
