

The first of these factors is the confrontation between XAU and the USD as two major monetary equivalents. In recent years, amid actions by US financial authorities, the dollar’s position has weakened. Previously, its share in global trade was close to absolute, but China is now pursuing a policy aimed at creating an alternative. Experts note that China conceals the actual volume of gold purchases for its reserves. This became evident as leading analytical platforms began using a new assessment methodology that allows approximate tracking of financial flows by comparing actual delivery reports compiled by regulators with data from the World Gold Council (WGC). Since 2010, these figures have started to diverge. In the third quarter of 2025, around 118.0 tonnes of gold entered China, of which only about one-third was officially declared. According to the experimental methodology, China’s total gold holdings amount to roughly 5,400 tonnes, while official reports cite only 2,304 tonnes. Such volumes are necessary for Beijing to support a dollar-alternative settlement system.
In addition, in late November 2025, the Governor of the Central Bank of the United Arab Emirates confirmed the creation of the international digital asset exchange platform mBridge. Within this framework, any country can exchange its national currency in a liquid precious metals market that includes a network of new vaults and clearing centers. The infrastructure of the Shanghai Stock Exchange is being considered for the implementation of this project, while the availability of physical reserves would allow China to become the main counterparty in exchange operations, reinforcing the dominance of the yuan. Moreover, total gold reserves held by central banks worldwide amount to approximately 40,225 tonnes, of which 49.0% belong to non-Western countries, compared with just 25.0% in 1990.
Investment demand also has a positive impact on prices. During the US government shutdown, the publication of reports by the Commodity Futures Trading Commission (CFTC) was suspended, and after the government resumed operations, experts began releasing data covering the missed period. As a result, up-to-date information has been unavailable to analysts for more than two months, forcing them to assess trends based solely on reports from the Chicago Mercantile Exchange (CME Group). In the week leading up to November 25, the number of net long positions in physically backed contracts stood at 135,364 thousand, while net short positions totaled 27,364 thousand, reflecting the continuation of the upward trend.
Technical indicators also continue to signal a buy. On the weekly chart, price remains above the resistance line of a broad ascending channel with boundaries at 4000.0–3350.0.
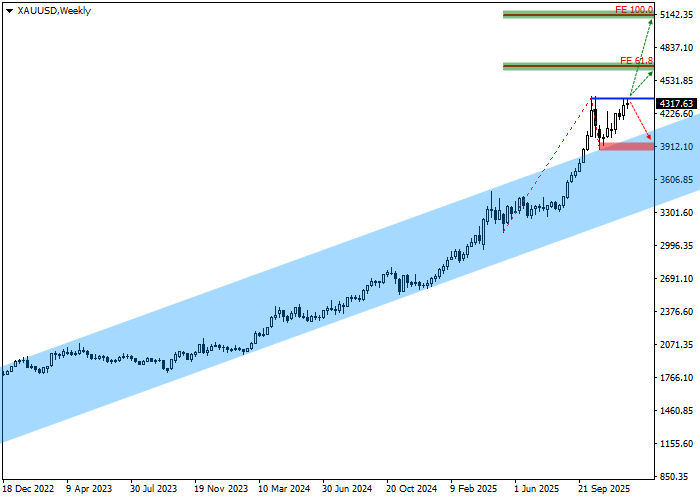
At present, a positive channel is forming with dynamic boundaries at 4300.0–4200.0. The 61.8% Fibonacci extension at 4660.0 represents the point where the trend may strengthen, while the 100.0% Fibonacci extension at 5140.0 serves as the target.
Key levels are best assessed on the daily timeframe.
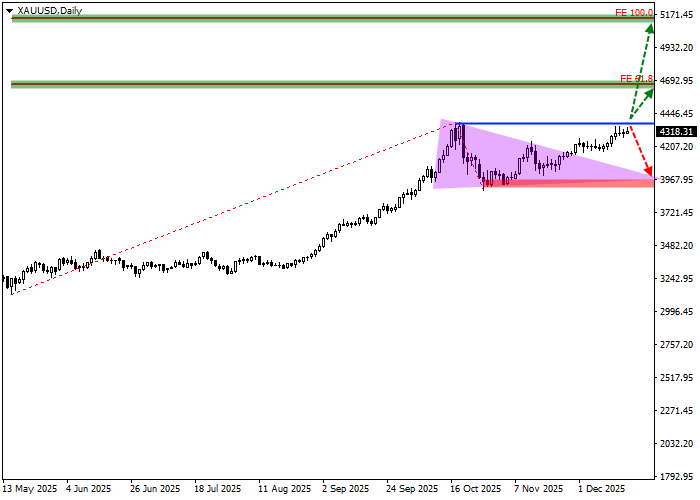
As shown on the chart, prices have broken out of the “triangle” pattern and are trading close to the annual high at 4380.0, indicating sufficient volume to overcome this level. If the market reaches the 3900.0 area, the bullish scenario would either be canceled or delayed, and open long positions should be closed. The target zone is located near 5140.0, which coincides with the 100.0% Fibonacci extension of the base trend. After testing this level, profits on long positions should be taken.
Entry levels should be assessed in more detail on the four-hour timeframe.
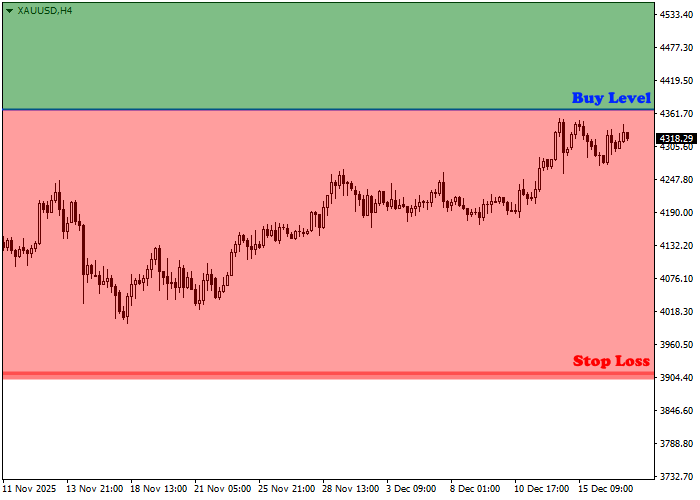
Buy entry levels are located at the annual high of 4360.0. Technically, a breakout and consolidation above this level would confirm the completion of the local “triangle” formation, after which no significant resistance would remain on the way to the target at 5140.0.
Given the average daily volatility of the instrument over the past month at 3,512 points, a move toward the target zone at 5140.0 could take approximately 57 trading sessions. If volatility increases, this timeframe could be reduced to around 48 trading days.
