

In addition, demand for precious metals is supported by heightened geopolitical tensions. Although the meeting between U.S. President Donald Trump and Russian President Vladimir Putin in Alaska initially gave investors hope for a swift resolution of the military conflict in Ukraine, the lack of progress has shifted focus back to safe-haven assets. The key catalyst behind the latest rally was the escalation in the Middle East, where 15 Israeli Air Force fighters carried out 10 missile strikes on a building in Doha where Hamas leadership was meeting with representatives of the Arab League to discuss the fate of Israeli hostages
Following reports of Israel’s actions, trading volumes spiked sharply. According to the Chicago Mercantile Exchange (CME Group), volumes in the first week of the month hit a year-to-date high of 606,000 contracts before easing to 368,000 on Friday, compared to a median of 150,000–170,000. Options positions also reached a yearly peak of 193,584 contracts, surpassing the August futures average: with gold prices at elevated levels, investors increasingly favor options over futures, as they provide downside protection while maintaining strong profit potential.
Support and Resistance Levels
On the daily chart, the instrument is pulling back from the resistance line of a “triangle” pattern with dynamic boundaries of 3,420.0–3,300.0.
Technical indicators are softening their buy signals as the pattern’s target is being fulfilled: the fast EMAs of the Alligator indicator remain well above the signal line, while the AO histogram forms corrective bars in positive territory.
Resistance levels: 3,700.0, 3,850.0.
Support levels: 3,580.0, 3,430.0.
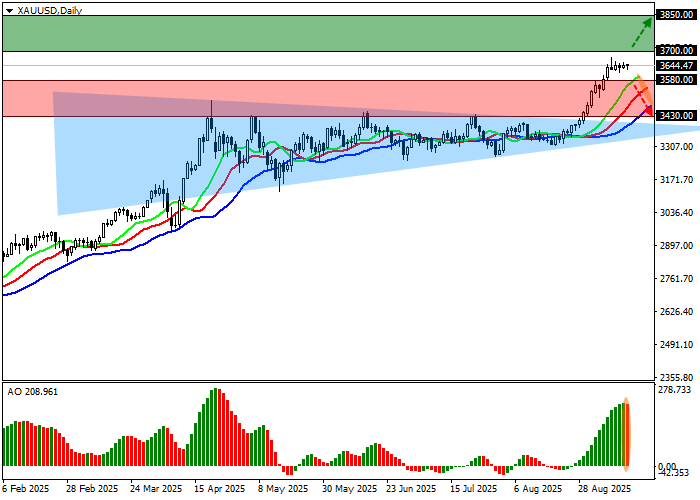
Trading Scenarios and Gold Price Forecast (XAU/USD)
Long positions can be opened after the price breaks and consolidates above 3,700.0, with a target of 3,850.0 and a stop-loss at 3,630.0. Implementation period: 7 days or more.
Short positions can be opened if the price breaks and consolidates below 3,580.0, with a target of 3,430.0 and a stop-loss at 3,640.0.
Scenario
| Timeframe | Weekly |
| Recommendation | BUY STOP |
| Entry Point | 3,700.0 |
| Take Profit | 3,850.0 |
| Stop Loss | 3,630.0 |
| Key Levels | 3,430.0, 3,580.0, 3,700.0, 3,850.0 |
Alternative Scenario
| Recommendation | SELL STOP |
| Entry Point | 3,580.0 |
| Take Profit | 3,430.0 |
| Stop Loss | 3,640.0 |
| Key Levels | 3,430.0, 3,580.0, 3,700.0, 3,850.0 |