

In August, U.S. nonfarm payrolls slowed sharply to 22k versus forecasts of 75k and July’s 79k. Average hourly earnings eased from 3.9% y/y to 3.7% y/y, holding steady at 0.3% m/m, while unemployment rose from 4.2% to 4.3%. Following this cooling in the labor market, expectations for a 50 bps Fed rate cut climbed to 12%, according to the CME FedWatch Tool.
Later today (16:00 GMT+2), revised employment data through March will be released, with estimates pointing to downward revisions of up to 598k jobs — a result that would increase pressure on the Fed ahead of the September 17 policy meeting. Traders are also awaiting the API weekly inventory report at 22:30 GMT+2, followed by EIA data tomorrow at 16:30 GMT+2, after the last reports showed a build of 0.622M and 2.415M barrels, respectively
Meanwhile, speculative positioning shows signs of correction. According to the CFTC report, net speculative positions in WTI fell from 109.5k to 102.4k contracts last week. Activity was spread across all categories, consistent with a sideways trend. Among producers, bullish positions totaled 485,650, versus 441,041 on the bearish side.
Support and resistance levels
-
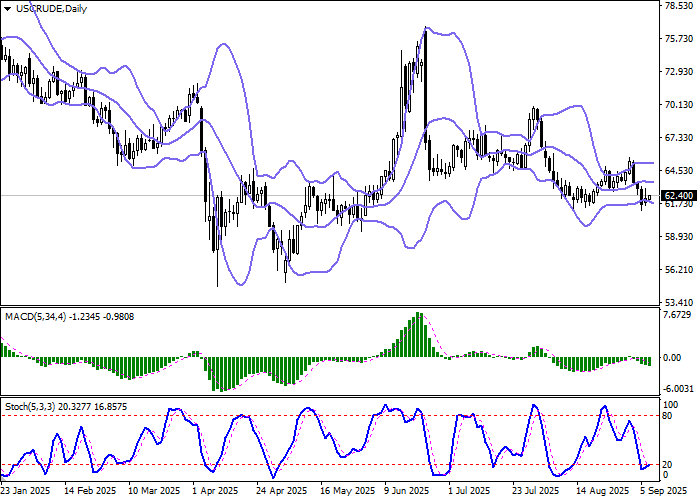
Resistance: 63.00, 64.00, 65.00, 66.00
-
Support: 62.00, 61.00, 60.05, 58.51
On the daily chart, Bollinger Bands are flattening as the range widens, leaving room for further downside. MACD stays below the signal line, keeping a weak sell bias. Stochastic, however, is attempting to exit oversold territory, hinting at a potential buy signal.
Trading scenarios
-
BUY STOP: Entry 63.00, TP 65.00, SL 62.00 (2–3 days)
-
SELL STOP: Entry 62.00, TP 60.05, SL 63.00
Key levels: 58.51, 60.05, 61.00, 62.00, 63.00, 64.00, 65.00, 66.00
