

Since December 17, the United States has imposed a full blockade on all sanctioned oil tankers traveling to or from Venezuela. The expansion of the sanctions list has led some shipping companies to refuse sending vessels to the country. According to S&P Global Commodities Insights, the number of tankers heading toward the Venezuelan coast declined from 24 to 17 over the past week. US President Donald Trump stated on the Truth Social platform that the comprehensive blockade was introduced due to what he described as the “theft of American assets, terrorism, trafficking of prohibited substances, and human trafficking” by Venezuelan authorities. At the same time, the situation does not affect US oil producer Chevron Corp., which continues operating in Venezuela. According to Bloomberg, Chevron has completed loading the tanker Searuby and is preparing to ship 1.0 million barrels of crude oil to the United States.
On Tuesday, the American Petroleum Institute (API) reported that US crude oil inventories declined by 9.3 million barrels, following a drawdown of 4.8 million barrels the previous week. Meanwhile, data from the US Energy Information Administration (EIA) showed a smaller decline of 1.274 million barrels after a decrease of 1.812 million barrels a week earlier.
Data from major exchanges indicate a gradual increase in trading volumes, which may signal growing fundamental pressure on the market. Figures from the Chicago Mercantile Exchange (CME Group Inc.) show that more than 1.1 million positions were traded yesterday, close to the highest level for December. This compares with an average of around 790,000 futures contracts per day last week. Against this backdrop, the current smooth downward trend may persist at least until the end of the year.
Support and Resistance Levels
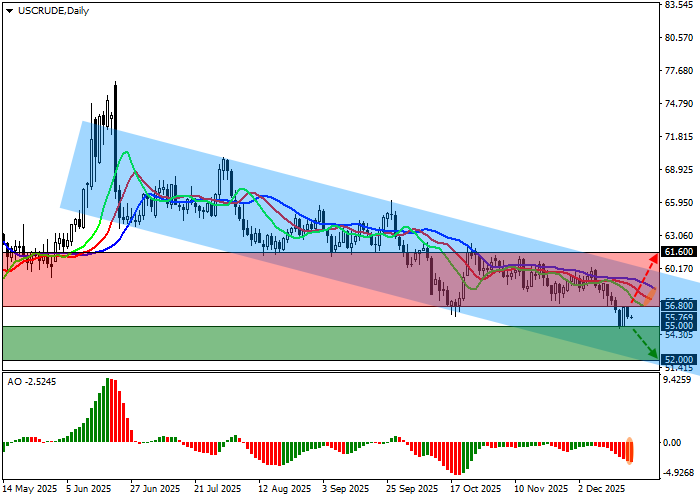
On the daily chart, the asset is correcting again, moving away from the resistance line of the descending channel with dynamic boundaries at 60.00–51.50.
Technical indicators are not yet signaling a reversal and continue to maintain a stable sell signal. The fast EMAs of the Alligator indicator remain well below the signal line, while the AO histogram is forming new corrective bars and stays far from the zero level.
Support levels: 55.00, 52.00.
Resistance levels: 56.80, 61.60.
Trading Scenarios and WTI Crude Oil Forecast
If the decline continues and the price consolidates below the 55.00 support level, short positions may be considered with a target at 52.00 and a stop-loss at 56.50. Time horizon: 7 days or longer.
If upward momentum develops and the price consolidates above the 56.80 resistance level, long positions may be considered with a target at 61.60 and a stop-loss at 55.00.
Scenario
| Timeframe | Weekly |
| Recommendation | SELL STOP |
| Entry point | 54.95 |
| Take Profit | 52.00 |
| Stop Loss | 56.50 |
| Key levels | 52.00, 55.00, 56.80, 61.60 |
Alternative Scenario
| Recommendation | BUY STOP |
| Entry point | 56.85 |
| Take Profit | 61.60 |
| Stop Loss | 55.00 |
| Key levels | 52.00, 55.00, 56.80, 61.60 |
