

The EU announced plans to accelerate its exit from Russian hydrocarbons, impose a full ban on transactions with Russian energy firms, and lower the price cap to $47.60 per barrel. Up to 118 vessels and 45 companies could also be added to the sanctions list. Commenting on the measures, U.S. Energy Secretary Chris Wright stated that if the bloc completely abandons Russian “black gold,” the U.S. would be capable of covering the supply gap with its own exports.
Meanwhile, the American Petroleum Institute (API) reported fuel stockpiles dropping from –3.420M barrels to –3.821M barrels, while U.S. Energy Information Administration (EIA) data showed crude inventories narrowing from –9.285M to –0.607M barrels, potentially signaling weaker output levels.
Trading volumes on WTI oil futures at the Chicago Mercantile Exchange (CME Group) remain elevated, reaching 1.04M contracts—well above the late August average of 650K–700K trades.
Support and Resistance Levels
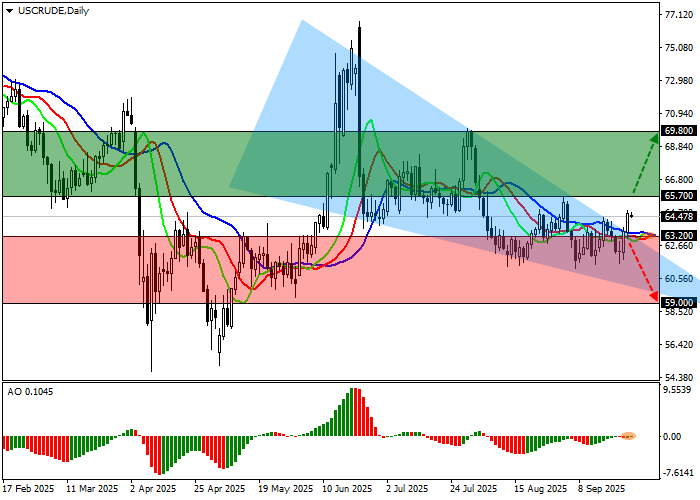
On the daily chart, the instrument is pulling back from the resistance line of a “triangle” pattern with dynamic boundaries between 64.00–60.00.
Technical indicators are close to reversal but still lean bearish: fast EMAs on the Alligator indicator sit slightly below the signal line, while the AO histogram prints corrective bars near the zero line.
Resistance levels: 65.70, 69.80.
Support levels: 63.20, 59.00.
Trading Scenarios and WTI Oil Price Forecast
Long positions may be considered after a breakout and close above 65.70, targeting 69.80. Stop-loss — 64.00. Timeframe: 7+ days.
Short positions may be opened after a decline and close below 63.20, targeting 59.00. Stop-loss — 65.00.
Scenario
| Timeframe | Weekly |
| Recommendation | BUY STOP |
| Entry Point | 65.75 |
| Take Profit | 69.80 |
| Stop Loss | 64.00 |
| Key Levels | 59.00, 63.20, 65.70, 69.80 |
Alternative Scenario
| Recommendation | SELL STOP |
| Entry Point | 63.15 |
| Take Profit | 59.00 |
| Stop Loss | 65.00 |
| Key Levels | 59.00, 63.20, 65.70, 69.80 |