

According to the American Petroleum Institute (API), fuel inventories rose from –3.674 million barrels to +2.780 million barrels for the week ending October 3, beating expectations of +2.250 million barrels. Today at 16:30 (GMT+2), data from the U.S. Energy Information Administration (EIA) is expected, with forecasts suggesting a decline from +1.792 million barrels to +0.400 million barrels. EIA experts expect inventories to reach 2.6 million barrels in Q4 and remain elevated through 2026. Meanwhile, OPEC+ members are projected to increase output less aggressively than planned to prevent a further price decline. On Sunday, eight cartel members who had previously agreed to voluntary cuts raised their November production quotas by 137,000 barrels.
Later today, at 21:00 (GMT+2), investors will focus on the Federal Reserve’s September meeting minutes. Markets expect further clarity on upcoming rate moves — CME FedWatch Tool data shows a 95% probability of a 25-basis-point rate cut in October. However, the prolonged government shutdown deprives the Fed of key employment data, forcing it to rely on indirect indicators at the October 28–29 policy meeting. Political uncertainty in the U.S. continues to weaken confidence in the dollar and supports interest in alternative assets.
Support and Resistance Levels
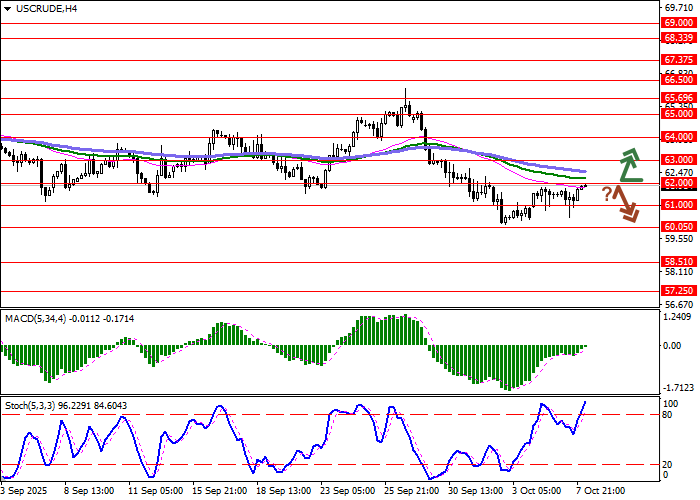
On the daily chart, Bollinger Bands are flattening, keeping a wide price range suitable for the current market activity. The MACD is rising and has formed a new buy signal (histogram above the signal line), while the Stochastic approaches the overbought zone near 80.
Resistance levels: 62.00, 63.00, 64.00, 65.00.
Support levels: 61.00, 60.05, 58.51, 57.25.
Trading Scenarios and Forecast for WTI Crude Oil
Long positions can be opened above 62.00 with a target of 64.00. Stop loss: 61.00. Implementation time: 1–2 days.
Short positions can be opened after a pullback from 62.00 and a breakout below 61.00, with a target of 58.51. Stop loss: 62.00.
Scenario
| Timeframe | Intraday |
| Recommendation | BUY STOP |
| Entry Point | 62.00 |
| Take Profit | 64.00 |
| Stop Loss | 61.00 |
| Key Levels | 57.25, 58.51, 60.05, 61.00, 62.00, 63.00, 64.00, 65.00 |
Alternative Scenario
| Recommendation | SELL STOP |
| Entry Point | 61.00 |
| Take Profit | 58.51 |
| Stop Loss | 62.00 |
| Key Levels | 57.25, 58.51, 60.05, 61.00, 62.00, 63.00, 64.00, 65.00 |
