

Earlier, in response to China’s restrictions on the export of rare-earth metals and components containing them, the White House had planned to impose an additional 157% tariff on Chinese goods starting November 1. However, investors now expect that the upcoming meeting between U.S. President Donald Trump and Chinese President Xi Jinping in South Korea at the end of the month could bring progress toward a compromise.
Meanwhile, oil prices face pressure from India’s uncertain stance in negotiations with the U.S. regarding Russian oil imports. Officially, New Delhi insists it will continue purchases, but Reuters reports that since Washington announced stricter sanctions for continued trade with Russia, Indian refiners have already reduced imports by 50%.
According to data from the American Petroleum Institute (API), fuel reserves fell from +3.524 million barrels to –2.980 million barrels. Later today, at 16:30 (GMT+2), investors will focus on Energy Information Administration (EIA) statistics, expected to show an inventory change from +3.524 million to +2.200 million barrels. Yesterday, the U.S. Department of Energy announced a new tender to purchase 1 million barrels of oil for the Strategic Petroleum Reserve — the first such move in six months — with deliveries scheduled for December and January, open only to U.S.-based producers.
Support and Resistance Levels
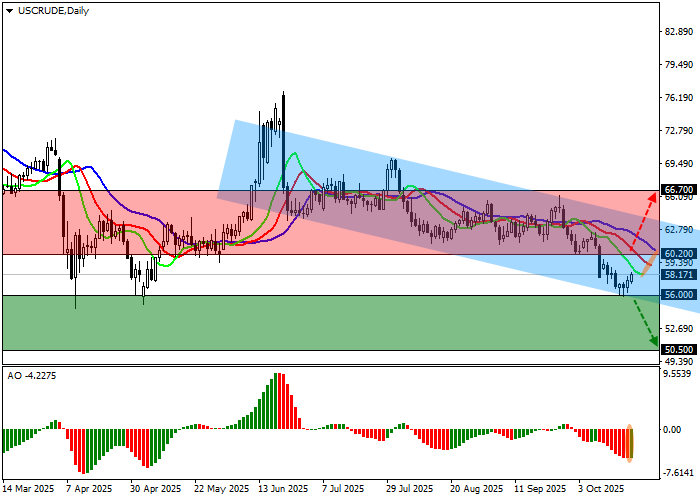
On the daily chart, WTI is correcting after approaching the lower boundary of a descending channel with dynamic limits between 63.00 and 56.00.
Technical indicators maintain a bearish signal: the fast EMAs of the Alligator indicator remain below the signal line, while the Awesome Oscillator histogram forms corrective bars near the zero level.
Resistance levels: 60.20, 66.70.
Support levels: 56.00, 50.50.
Trading Scenarios and WTI Crude Oil Forecast
Short positions may be opened after a decline and consolidation below 56.00, targeting 50.50. Stop-loss — 58.00. Duration: 7 days or more.
Long positions may be opened after a breakout and consolidation above 60.20, targeting 66.70. Stop-loss — 58.00.
Scenario
| Timeframe | Weekly |
| Recommendation | SELL STOP |
| Entry Point | 55.95 |
| Take Profit | 50.50 |
| Stop Loss | 58.00 |
| Key Levels | 50.50, 56.00, 60.20, 66.70 |
Alternative Scenario
| Recommendation | BUY STOP |
| Entry Point | 60.25 |
| Take Profit | 66.70 |
| Stop Loss | 58.00 |
| Key Levels | 50.50, 56.00, 60.20, 66.70 |