

Gold pricing is also shaped by upcoming Fed policy decisions and questions over the central bank’s independence. Trump continues to pressure the Fed, with speculation that Christopher Waller, a well-known dove, may be the next chair. Markets expect a 25 bps rate cut at the September 19 FOMC meeting, but tensions between the administration and the central bank remain a key factor.
Investment demand has spiked since the court ruling. According to CME data, gold trading volume hit a yearly high of 601,000 contracts on September 2. Open interest in options reached 193,584, compared with a total of 187,000 across futures and options as of August 25 — reflecting a surge in market activity.
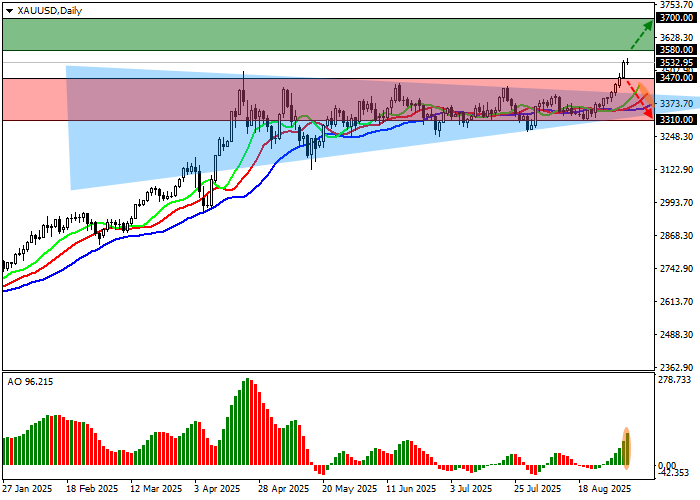
Support and Resistance
On the daily chart, the pair is retreating from the resistance line of a triangle pattern (3420.0–3300.0).
Technical indicators reinforce buy signals after price broke above the pattern resistance: fast EMAs in the Alligator indicator are well above the signal line, while the AO histogram prints corrective bars in positive territory.
-
Resistance: 3580.0, 3700.0
-
Support: 3470.0, 3310.0
Trading Scenarios
Primary (BUY STOP)
-
Entry: 3580.5
-
Take Profit: 3700.0
-
Stop Loss: 3520.0
-
Horizon: 7+ days
Alternative (SELL STOP)
-
Entry: 3469.5
-
Take Profit: 3310.0
-
Stop Loss: 3560.0
Key Levels: 3310.0, 3470.0, 3580.0, 3700.0