

It is worth recalling that the day before, U.S. President Donald Trump stated that he is allowing 10–15 days to fully finalize a nuclear deal. After that, a direct strike on Iranian territory is likely, as U.S. military infrastructure in the region is already fully deployed. Experts fear that in response, the Islamic republic could block the Strait of Hormuz, resulting in the loss of 20.0% of global oil supplies and a sharp rise in energy prices. According to some estimates, the geopolitical risk premium could reach $150.0 per barrel. All this would slow not only the U.S. economy but also global growth, prompting investors to favor precious metals as a more reliable store of value.
On the other hand, a strong rally in platinum prices is being restrained by monetary factors, as the likelihood of maintaining the current U.S. Federal Reserve policy increases. According to the minutes of the January meeting, some officials believe that high labor productivity driven by technological innovation could put downward pressure on inflation. However, most policymakers are concerned that progress toward the inflation target may be slower and more uneven than expected. For the first time in a long while, the document also acknowledges the possibility of an interest rate hike if consumer inflation remains persistently above the 2.0% target. Nevertheless, experts still expect at least two rounds of monetary easing this year. At 15:30 (GMT+2), U.S. GDP data will be released: preliminary estimates suggest that growth in the fourth quarter slowed from 4.4% to 2.8%, still not calling for monetary stimulus. At the same time, the core personal consumption expenditures (PCE) price index is expected to rise from 0.2% to 0.3% month-on-month and from 2.8% to 2.9% year-on-year, which would strengthen the case for a more hawkish stance and support the U.S. dollar.
Support and resistance levels
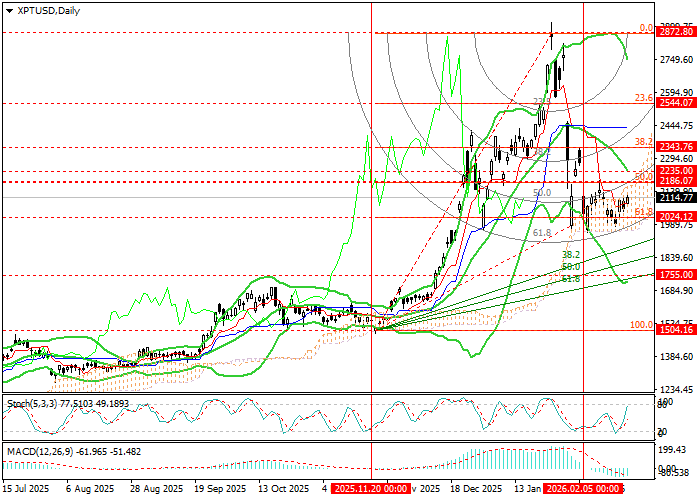
The instrument is moving within the 2186.07–2012.14 range (50.0–61.5% Fibonacci retracement). After a firm break above the resistance zone at 2235.00–2186.07 (the middle Bollinger Band and the 50.0% Fibonacci level), prices could return to the areas of 2544.07 (23.6% Fibonacci retracement) and 2872.80 (0.0% Fibonacci). Conversely, if consolidation occurs below 2024.12 (61.8% Fibonacci retracement), a move toward 1755.00 (61.8% reverse fan line) and 1504.16 (100.0% Fibonacci retracement) becomes likely.
Technical indicators provide mixed signals: Bollinger Bands are turning downward, the MACD histogram remains stable in negative territory, while the Stochastic oscillator is pointing upward.
Resistance levels: 2235.00, 2544.07, 2872.80.
Support levels: 2024.12, 1755.00, 1504.16.
Trading scenarios and XPT/USD outlook
Long positions can be opened above 2235.00 with targets at 2544.07 and 2872.80, and a stop-loss at 2080.00. Time horizon: 5–7 days.
Short positions can be opened below 2024.12 with targets at 1755.00 and 1504.16, and a stop-loss at 2190.00.
Scenario
| Timeframe | Weekly |
| Recommendation | BUY STOP |
| Entry point | 2235.05 |
| Take Profit | 2544.07, 2872.80 |
| Stop Loss | 2080.00 |
| Key levels | 1504.16, 1755.00, 2024.12, 2235.00, 2544.07, 2872.80 |
Alternative scenario
| Recommendation | SELL STOP |
| Entry point | 2024.10 |
| Take Profit | 1755.00, 1504.16 |
| Stop Loss | 2190.00 |
| Key levels | 1504.16, 1755.00, 2024.12, 2235.00, 2544.07, 2872.80 |
