

Investors focused on the results of the People’s Bank of China meeting: as expected, the main lending rate was left unchanged at 3.00%. The last adjustment came in May, when the rate was cut by 10 basis points. Analysts now anticipate that in the coming months Chinese authorities may take more aggressive easing measures amid weak economic performance. Forecasts suggest China’s GDP could grow by 4.5% in 2025.
In Australia, S&P Global’s September business activity data was published today: the manufacturing PMI fell from 53.0 to 51.6, the services PMI dropped from 55.8 to 52.0, and the composite index declined from 55.5 to 52.1.
Later today in the U.S. at 15:45 (GMT+2), business activity data will also be released: analysts expect the manufacturing PMI to ease from 53.0 to 52.0, and the services PMI to slip from 54.5 to 53.9. At 18:35 (GMT+2), Fed Chair Jerome Powell will deliver remarks that could clarify the outlook for further monetary policy easing this year.
On Friday at 14:30 (GMT+2), U.S. personal consumption expenditure (PCE) data will be published—an important indicator for the Fed. The core PCE index is expected to remain at 2.9% year-over-year, while the monthly figure is forecast to slow from 0.3% to 0.2%.
Support and Resistance Levels
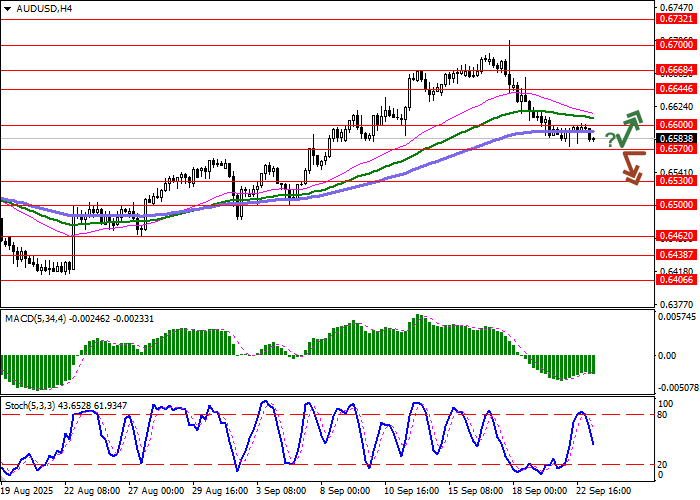
Bollinger Bands on the daily chart show signs of flattening, with the price range narrowing and reflecting mixed sentiment in the short term. MACD is falling, maintaining a solid sell signal as the histogram remains below the signal line. Stochastic is also trending lower but hovers near oversold territory, indicating risks of short-term AUD overselling.
Resistance levels: 0.6600, 0.6644, 0.6668, 0.6700.
Support levels: 0.6570, 0.6530, 0.6500, 0.6462.
Trading Scenarios and Forecast for AUD/USD
Short positions may be considered after a confident break below 0.6570, with a target at 0.6500. Stop-loss: 0.6600. Time horizon: 1–2 days.
A rebound from 0.6570 as support, followed by a breakout above 0.6600, could be a signal to open new long positions targeting 0.6668. Stop-loss: 0.6570.
Scenario
| Timeframe | Intraday |
| Recommendation | SELL STOP |
| Entry Point | 0.6565 |
| Take Profit | 0.6500 |
| Stop Loss | 0.6600 |
| Key Levels | 0.6462, 0.6500, 0.6530, 0.6570, 0.6600, 0.6644, 0.6668, 0.6700 |
Alternative Scenario
| Recommendation | BUY STOP |
| Entry Point | 0.6605 |
| Take Profit | 0.6668 |
| Stop Loss | 0.6570 |
| Key Levels | 0.6462, 0.6500, 0.6530, 0.6570, 0.6600, 0.6644, 0.6668, 0.6700 |