
The Fed will hold its meeting without access to a full set of economic data due to the ongoing U.S. government shutdown. In particular, the September employment report was never released in October, removing one of the main arguments for lowering borrowing costs. The White House has warned that by November 15, salary payments to military personnel could be delayed, while airlines may also face disruptions ahead of the busy Thanksgiving travel period. Meanwhile, President Donald Trump’s approval rating has dropped noticeably, with only 43.8% of respondents supporting his actions compared to 53.1% disapproving.
Tomorrow at 11:00 (GMT+2), Germany’s Q3 GDP report will be released. Forecasts suggest zero quarterly growth after a 0.3% decline in the previous period, while the annual rate may rise from 0.2% to 0.3%. The same day, eurozone GDP data will follow, with expectations of a slowdown from 1.5% to 1.2% year-over-year, and a marginal 0.1% quarterly increase.
Although the European Central Bank (ECB) has managed to control inflation, stagnation risks persist. Growth in business activity is largely driven by higher government spending on defense and infrastructure modernization. Meanwhile, political instability remains an issue in several countries—most notably in France, where analysts expect difficulties in passing the 2026 budget bill.
Support and Resistance Levels
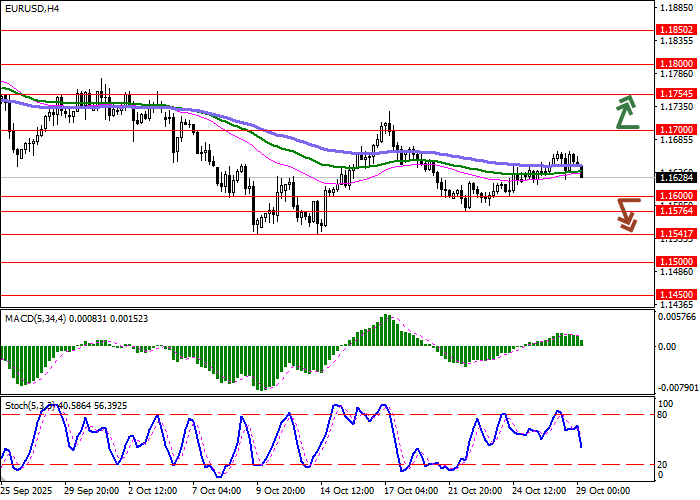
On the daily chart, Bollinger Bands show flat dynamics, with the price range narrowing from below, reflecting mixed short-term trading sentiment. The MACD is rising, maintaining a weak buy signal as the histogram stays above the signal line. The indicator is also approaching the zero mark, and a breakout above it could confirm a buying opportunity. The Stochastic oscillator, having bounced from the “80” level, turned downward, signaling a potential short-term bearish correction.
Resistance levels: 1.1700, 1.1754, 1.1800, 1.1850.
Support levels: 1.1600, 1.1576, 1.1541, 1.1500.
Trading Scenarios and EUR/USD Outlook
Short positions can be considered after a confident breakout below 1.1600, with a target of 1.1500 and a stop loss at 1.1650. Time frame: 2–3 days.
A return to bullish momentum with a breakout above 1.1700 would signal new long positions targeting 1.1800, with a stop loss at 1.1650.
Scenario
| Timeframe | Intraday |
| Recommendation | SELL STOP |
| Entry Point | 1.1595 |
| Take Profit | 1.1500 |
| Stop Loss | 1.1650 |
| Key Levels | 1.1500, 1.1541, 1.1576, 1.1600, 1.1700, 1.1754, 1.1800, 1.1850 |
Alternative Scenario
| Recommendation | BUY STOP |
| Entry Point | 1.1705 |
| Take Profit | 1.1800 |
| Stop Loss | 1.1650 |
| Key Levels | 1.1500, 1.1541, 1.1576, 1.1600, 1.1700, 1.1754, 1.1800, 1.1850 |