
Germany’s August industrial data confirmed the ongoing slowdown: new factory orders fell by 0.8% versus expectations of a 1.2% increase, marking the fourth consecutive decline, while industrial production plunged by 4.3% against the forecast of –1.0%, the steepest drop in three years. The automotive sector was hit particularly hard following the introduction of U.S. import tariffs. The data significantly increases the likelihood of Germany’s GDP contraction in Q3 and a technical recession, while France’s developing political crisis has already begun to impact macroeconomic indicators. The outgoing French government had planned a new budget aimed at reducing spending and raising taxes to shrink the 2024 deficit of 5.8% and address the national debt, which reached 113% of GDP. Those fiscal adjustments are now postponed indefinitely following the resignation of Prime Minister Sébastien Lecornu, who served less than a month.
Against this backdrop, investors are shifting away from the euro in favor of the U.S. dollar, especially as the Federal Reserve’s next steps on monetary easing have once again come into question. Comments from Fed officials show no consensus: some board members advocate rate cuts to support the labor market, while others insist on maintaining the current policy settings as inflation remains well above the 2.0% target. The lack of fresh macroeconomic data due to the ongoing U.S. government shutdown may strengthen the position of the “hawks.”
Overall, the fundamental background still favors a continuation of the downside correction.
Support and Resistance Levels
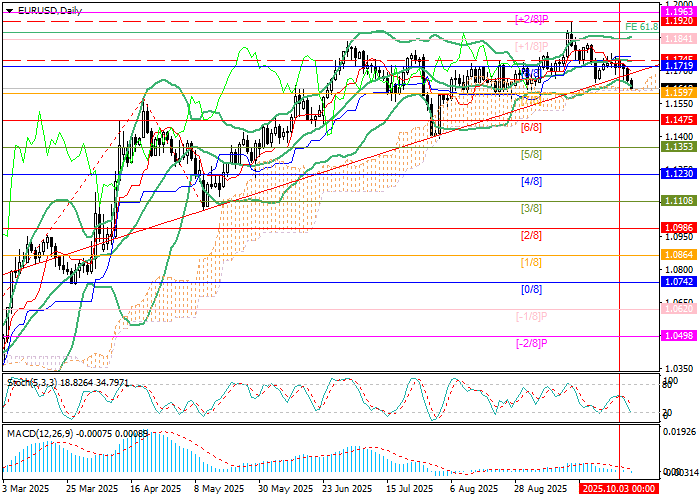
The pair is approaching 1.1597 (Murray level [7/8]); a breakout below it would open the way to 1.1475 (Murray level [6/8]) and 1.1353 (Murray level [5/8]). For “bulls,” the key resistance lies near the middle Bollinger Band at 1.1745 — its breakout could drive the pair toward 1.1920 (recent highs) and 1.1963 (Murray level [+2/8]).
Technical indicators suggest continued bearish momentum: Bollinger Bands and Stochastic are turning downward, while MACD has entered the negative zone.
Resistance levels: 1.1745, 1.1920, 1.1963.
Support levels: 1.1597, 1.1475, 1.1353.
Trading Scenarios and EUR/USD Forecast
Short positions may be opened below 1.1597 with targets at 1.1475 and 1.1353, and a stop loss at 1.1680. Implementation period: 5–7 days.
Long positions may be opened above 1.1745 with targets at 1.1920 and 1.1963, and a stop loss at 1.1660.
Scenario
| Timeframe | Weekly |
| Recommendation | SELL STOP |
| Entry Point | 1.1595 |
| Take Profit | 1.1475, 1.1353 |
| Stop Loss | 1.1680 |
| Key Levels | 1.1353, 1.1475, 1.1597, 1.1745, 1.1920, 1.1963 |
Alternative Scenario
| Recommendation | BUY STOP |
| Entry Point | 1.1745 |
| Take Profit | 1.1920, 1.1963 |
| Stop Loss | 1.1660 |
| Key Levels | 1.1353, 1.1475, 1.1597, 1.1745, 1.1920, 1.1963 |
