
Ahead of the informal summit of eurozone leaders, which begins today in Brussels, the results of an internal market study assessing competitiveness relative to the United States and China were published. The EU was found to have advantages in only 3 out of 22 key criteria, while in most areas it lags behind the world’s two largest economies. The primary factor behind this gap remains high resource costs. More than 50.0% of companies surveyed by analysts reported that their costs exceed those of foreign competitors, often by more than 10.0%. A significant share of expenses comes from raw materials and fuel (around 20.0%), as well as electricity costs, which in the EU are 2–3 times higher than in the United States and in some industries account for 14.0–34.0% of total costs, intensifying structural pressure on business margins.
The institutional environment remains an additional constraint. According to Deloitte, 32.0% of European companies view regulatory complexity as a serious barrier to long-term capital investment, with approval timelines for major projects stretching up to nine years — 1.5–2 times longer than comparable procedures in the United States. Dependence on external energy supplies is also significant: around 63.0% of the EU’s energy needs are covered by imports, compared with about 21.0% in China, while the United States remains a net exporter. Under the climate agenda, further pressure comes from decarbonization investments: upgrading the four most energy-intensive sectors — chemicals, metallurgy, non-metallic mineral products, and pulp and paper — is estimated to require around €500.0 billion over the next 15 years.
On the domestic front, additional pressure on the euro came from data out of Italy, where industrial production in December declined by –0.4% after a 1.5% increase previously, while annual growth accelerated to 3.2% from 1.4%.
The U.S. dollar is holding near 96.7 points on the USDX and may soon break its short-term downward trend that began late last week after preliminary nonfarm employment data from Automatic Data Processing (ADP), based on a survey of around 400,000 businesses, showed a slowdown from 37.0 thousand to 22.0 thousand jobs against a forecast of 46.0 thousand. In contrast, the official federal report confirmed an increase of 130.0 thousand jobs, well above December’s 48.0 thousand, with private-sector employment rising by 172.0 thousand versus 64.0 thousand previously. Against this backdrop, the overall unemployment rate fell from 4.4% to 4.3%, while revised seasonally adjusted employment data for 2025 now point to a decline of 862.0 thousand, an improvement compared with the previously reported –911.0 thousand.
As a result, the probability that the U.S. Federal Reserve will keep borrowing costs in the 3.50–3.75% range at its March 18 meeting has risen to 93.6%, according to the CME FedWatch Tool.
Support and Resistance Levels
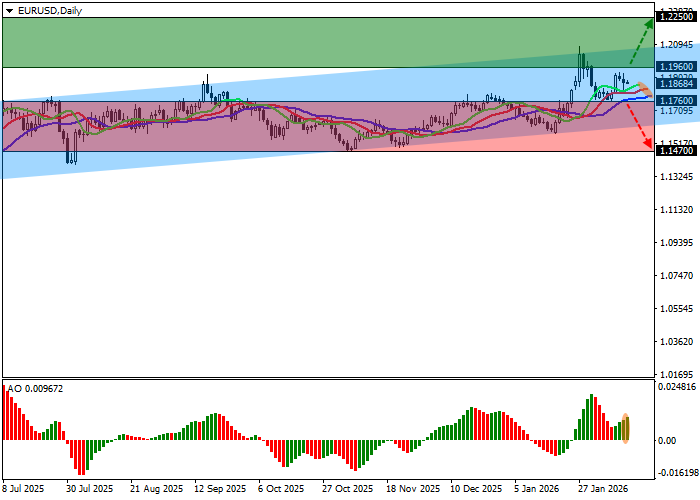
On the daily chart, the instrument is approaching the resistance line of an ascending channel with boundaries at 1.2160–1.1650.
Technical indicators continue to signal long positions, a signal generated in late January: the fast EMAs on the Alligator indicator remain above the signal line and continue to widen their range, while the AO histogram is forming new corrective bars and rising in the buying zone.
Support levels: 1.1760, 1.1470.
Resistance levels: 1.1960, 1.2250.
Trading Scenarios and EUR/USD Forecast
Long positions can be opened after a sustained breakout above 1.1960, targeting 1.2250. Stop-loss: 1.1870. Time horizon: 7 days or longer.
Short positions can be opened after a sustained move below 1.1760, targeting 1.1470. Stop-loss: 1.1850.
Scenario
| Timeframe | Weekly |
| Recommendation | BUY STOP |
| Entry point | 1.1965 |
| Take Profit | 1.2250 |
| Stop Loss | 1.1870 |
| Key levels | 1.1470, 1.1760, 1.1960, 1.2250 |
Alternative Scenario
| Recommendation | SELL STOP |
| Entry point | 1.1755 |
| Take Profit | 1.1470 |
| Stop Loss | 1.1850 |
| Key levels | 1.1470, 1.1760, 1.1960, 1.2250 |
