

The British currency came under pressure after European authorities decided to cut duty-free steel import quotas by 47.0% and to impose 50.0% tariffs on shipments exceeding that quota. Officials justified the move as a way to provide reliable protection for the EU steel industry and preserve jobs. This will primarily pressure the UK’s industrial sector, which accounts for 78.0% of foreign steel supplies to the bloc. Combined with the recently introduced 25.0% U.S. tariffs, these measures could significantly harm not only steelmakers but the broader UK economy, potentially affecting about 80,000 jobs. Industrial companies have already urged the government to reach a deal with the EU, but that will take time, leaving them under double pressure in the interim.
On the other hand, the U.S. dollar is supported by comments from Federal Reserve officials that temper confidence in further rate cuts this year. Yesterday, Kansas City Fed President Jeffrey Schmid said companies are delaying hiring amid uncertainty surrounding the tariff policies initiated by President Donald Trump. However, a number of indicators — including a 4.3% unemployment rate — suggest the labor market remains broadly healthy. At the same time, he expects that by August price increases will be observed in 80.0% of tracked goods categories, making the fight against inflation a priority. Schmid is supported by a number of officials, making a postponement of monetary easing a realistic possibility.
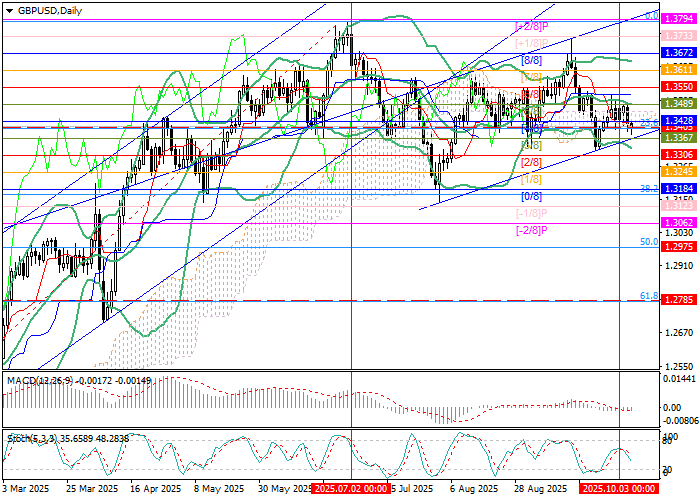
Support and resistance levels
The instrument is testing 1.3405 (23.6% Fibonacci retracement). A firm break below would force an exit from the short-term ascending channel through its lower boundary and extend the decline toward 1.3306 (Murray level [2/8]) and 1.3184 (Murray level [0/8]). The key level for bulls is seen at 1.3489 (Murray level [5/8]), reinforced by the middle Bollinger Band: a breakout above it would resume the advance toward 1.3611 (Murray level [7/8]) and 1.3733 (Murray level [+2/8]).
Technical indicators allow for a downside scenario: Bollinger Bands and Stochastic are turning lower, while MACD has moved into negative territory.
Resistance levels: 1.3489, 1.3611, 1.3733.
Support levels: 1.3405, 1.3306, 1.3184.
Trading scenarios for GBP/USD
Short positions may be opened below 1.3405 with targets at 1.3306 and 1.3184, and a stop-loss at 1.3470. Implementation period: 5–7 days.
Long positions may be opened above 1.3489 with targets at 1.3611 and 1.3733, and a stop-loss at 1.3420.
Scenario
| Timeframe | Weekly |
| Recommendation | SELL STOP |
| Entry point | 1.3400 |
| Take Profit | 1.3306, 1.3184 |
| Stop Loss | 1.3470 |
| Key levels | 1.3184, 1.3306, 1.3405, 1.3489, 1.3611, 1.3733 |
Alternative scenario
| Recommendation | BUY STOP |
| Entry point | 1.3490 |
| Take Profit | 1.3611, 1.3733 |
| Stop Loss | 1.3420 |
| Key levels | 1.3184, 1.3306, 1.3405, 1.3489, 1.3611, 1.3733 |
