

Forecasts suggest an acceleration in annual inflation from 2.7% to 2.9%, which could somewhat weaken market expectations regarding a September rate cut by the U.S. Federal Reserve. The core index excluding food and energy is expected to remain at 3.1% in August. Additionally, on Thursday at 14:30 (GMT+2), labor market data will be published: analysts expect initial jobless claims for the week ending September 5 to rise from 237,000 to 240,000, while continuing claims may decline from 1.94 million.
The U.S. dollar remains under pressure following the Labor Department report, which confirmed the need for monetary easing. This also provided leverage for President Donald Trump’s administration, which in recent months has actively criticized Fed Chair Jerome Powell. In August, nonfarm payrolls rose by just 22,000 after 79,000 in the previous month (revised from 73,000), versus forecasts of 70,000. The labor force participation rate ticked up from 62.2% to 62.3%, while unemployment increased from 4.2% to 4.3%. Average hourly earnings slowed from 3.9% to 3.7% y/y, though they rose 0.3% m/m. Revised data released yesterday showed the U.S. economy created 911,000 fewer jobs in the 12 months ending in March than initially estimated.
In the UK, July GDP and industrial production figures will be released Friday at 08:00 (GMT+2). Analysts currently expect GDP growth to slow from 0.4% to 0.1% m/m, while industrial production is forecast to accelerate from 0.2% to 1.1%. Meanwhile, HSBC experts project that the Bank of England will not cut interest rates until April due to concerns over rising inflation. They noted that price growth has been “sharper than in other Western economies” and that policymakers are signaling a more “hawkish” stance. Recall that the Labour Party’s decision to raise national insurance contributions has contributed to inflation climbing to 3.8% — an 18-month high and the highest among G7 economies. By year-end, inflation is expected to reach 4.0%.
Support and GBP/USD Forecast
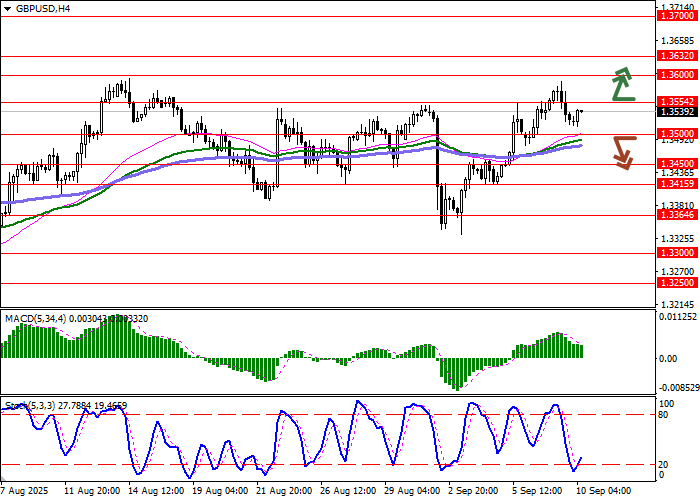
Bollinger Bands on the daily chart show flat dynamics, with the price range slightly expanding to the upside, opening the way for bulls to new local highs. MACD is rising, maintaining a weak buy signal (the histogram remains above the signal line). Stochastic, having approached the “80” mark, is attempting to turn downward, reacting to yesterday’s bearish dynamics.
Resistance levels: 1.3554, 1.3600, 1.3632, 1.3700.
Support levels: 1.3500, 1.3450, 1.3415, 1.3364.
Trading Scenarios
Long positions may be opened after a confident breakout above 1.3554, with a target at 1.3650 and a stop-loss at 1.3500. Implementation period: 2–3 days.
Renewed bearish activity with a breakout below 1.3500 could signal short positions with a target at 1.3400 and a stop-loss at 1.3554.
Scenario
-
Timeframe: Intraday
-
Recommendation: BUY STOP
-
Entry Point: 1.3555
-
Take Profit: 1.3650
-
Stop Loss: 1.3500
-
Key Levels: 1.3364, 1.3415, 1.3450, 1.3500, 1.3554, 1.3600, 1.3632, 1.3700
Alternative Scenario
-
Recommendation: SELL STOP
-
Entry Point: 1.3500
-
Take Profit: 1.3400
-
Stop Loss: 1.3554
-
Key Levels: 1.3364, 1.3415, 1.3450, 1.3500, 1.3554, 1.3600, 1.3632, 1.3700
