
In October, the Ivey Business Activity Index fell sharply from 59.8 to 52.4 points, below the expected 55.2, while the composite index excluding seasonal adjustments dropped from 61.6 to 51.7 points, pressured by U.S. trade sanctions. Since Statistics Canada relies on export and import data from the U.S. Census Bureau — which has suspended publication due to the ongoing government shutdown — the country’s international trade report has also been postponed, tentatively until November 27–28.
Earlier this week, Prime Minister Mark Carney presented the federal budget aimed at stimulating economic growth, projecting a deficit of 78.3 billion Canadian dollars for fiscal years 2025–2026 — significantly higher than the 42.2 billion dollars estimated in December’s fiscal update. The plan includes 32.5 billion dollars in net new capital spending over five years and forecasts an operating surplus of 1.7 billion dollars by 2028–2029. Economists note that, against the backdrop of U.S. trade policy, the document focuses on long-term goals, with business support measures designed to improve productivity and reduce uncertainty. On the other hand, it allocates little direct funding to offset the rising cost of living. The government, however, insists that the planned initiatives will help raise average wages and generate revenues to sustain healthcare and lower taxes.
The U.S. dollar continued to weaken, reaching 99.60 on the USDX index. With official data limited, investors turned their attention to the Challenger, Gray & Christmas report on U.S. layoffs, which showed the largest monthly job cut in more than 20 years — 153,074 positions versus 54,060 previously — largely due to the adoption of artificial intelligence (AI) technologies. According to the CME FedWatch Tool, the probability of a dovish Fed stance at the December meeting rose from 62.0% to 67.0% as markets priced in higher unemployment expectations.
Support and Resistance Levels
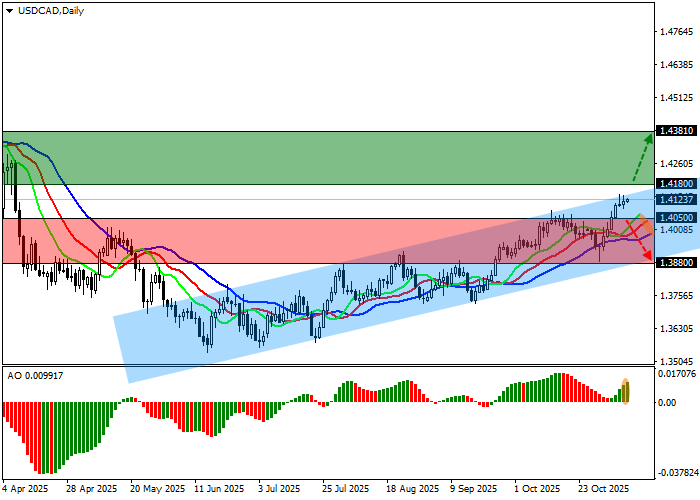
On the daily chart, the price is correcting below the resistance line of the ascending channel, with boundaries at 1.4170–1.3880.
Technical indicators still point to a buy signal: the range between the Alligator’s EMA lines remains wide, the fast EMAs are above the signal line, and the Awesome Oscillator (AO) histogram is forming corrective bars slightly above the zero line.
Resistance levels: 1.4180, 1.4381.
Support levels: 1.4050, 1.3880.
Trading Scenarios and USD/CAD Outlook
Long positions can be considered after the price rises and consolidates above 1.4180, with a target of 1.4381 and a stop-loss at 1.4100. Implementation period: 7 days or more.
Short positions can be considered after the price drops and consolidates below 1.4050, with a target of 1.3880 and a stop-loss at 1.4120.
Scenario
| Timeframe | Weekly |
| Recommendation | BUY STOP |
| Entry Point | 1.4180 |
| Take Profit | 1.4381 |
| Stop Loss | 1.4100 |
| Key Levels | 1.3880, 1.4050, 1.4180, 1.4381 |
Alternative Scenario
| Recommendation | SELL STOP |
| Entry Point | 1.4050 |
| Take Profit | 1.3880 |
| Stop Loss | 1.4120 |
| Key Levels | 1.3880, 1.4050, 1.4180, 1.4381 |