
At the end of last week, the United States did not release key macroeconomic data due to the record-long government shutdown, which disrupted federal operations until lawmakers finally approved temporary funding through the end of January 2026. Later today, at 15:30 (GMT+2), the market will receive the New York Fed Manufacturing Index for November. Forecasts suggest a decline from 10.7 to 6.1 points. On Wednesday at 21:00 (GMT+2), the minutes of the latest Federal Reserve meeting will be published, which may provide more clarity on the central bank’s rate-adjustment outlook.
Canada will also publish important inflation data today at 15:30 (GMT+2), which could influence the Bank of Canada’s stance on future policy easing. The core CPI currently stands at 2.8% year-over-year and 0.2% month-over-month, broadly in line with the central bank’s target. The broader inflation gauge is increasing at an even slower pace — 2.4% and 0.1%, respectively.
On September 17, the Bank of Canada cut its key interest rate by 25 basis points to 2.50%, the lowest level in three years. The decision was unanimous, and officials did not rule out additional easing in light of slowing economic activity and shifting inflation risks. However, economists at Scotiabank believe the dovish phase is already ending and expect borrowing costs to rise again by the second half of 2026. Despite persistent trade tensions, analysts argue the September cut was more of a “protective measure” than stimulus and could be reversed once economic conditions stabilize. They project real GDP growth of 1.2% this year and 1.4% next year, supported by fiscal measures and a gradual recovery in business investment. Structural issues such as weak productivity and slowing population growth will continue to limit potential output, but Scotiabank expects stronger government spending and new industrial investments to offset these headwinds and prevent a deeper slowdown. Meanwhile, major banks — TD, RBC Royal Bank, and Canadian Imperial Bank of Commerce — expect the Bank of Canada to keep its key rate at 2.25% through 2026.
Support and resistance levels
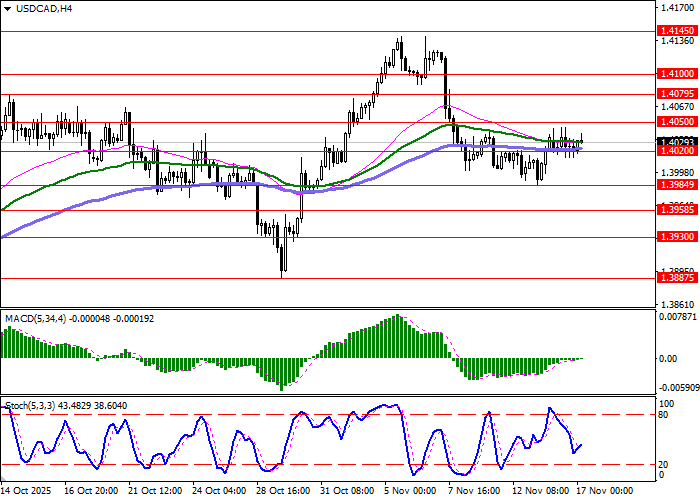
Bollinger Bands on the daily chart are edging higher, while the narrowing range reflects the mixed short-term trading picture. MACD continues to fade, maintaining a mild bearish signal with the histogram below the signal line. Stochastic, on the other hand, points to a possible continuation of the upward move in the near term.
Resistance levels: 1.4050, 1.4079, 1.4100, 1.4145.
Support levels: 1.4020, 1.3984, 1.3958, 1.3930.
Trading outlook for USD/CAD
Long positions become attractive after a confident breakout above 1.4050, with a target at 1.4100. Stop-loss: 1.4020. Estimated duration: 2–3 days.
A pullback from 1.4050 as resistance followed by a break below 1.4020 may trigger new short positions targeting 1.3958. Stop-loss: 1.4050.
Primary scenario
| Timeframe | Intraday |
| Recommendation | BUY STOP |
| Entry point | 1.4050 |
| Take Profit | 1.4100 |
| Stop Loss | 1.4020 |
| Key levels | 1.3930, 1.3958, 1.3984, 1.4020, 1.4050, 1.4079, 1.4100, 1.4145 |
Alternative scenario
| Recommendation | SELL STOP |
| Entry point | 1.4020 |
| Take Profit | 1.3958 |
| Stop Loss | 1.4050 |
| Key levels | 1.3930, 1.3958, 1.3984, 1.4020, 1.4050, 1.4079, 1.4100, 1.4145 |