

Fed Chair Jerome Powell’s speech at the Jackson Hole Economic Symposium gave investors hope for a rate cut at the September meeting, as he acknowledged the possibility of adjusting monetary policy if labor market risks intensified. Against this backdrop, quotes fell significantly. However, on Friday, the negative momentum slowed after the release of July personal consumption expenditure (PCE) price index data: on an annual basis, the indicator rose from 2.8% to 2.9%, confirming mounting inflationary pressures and reducing the likelihood of near-term borrowing cost adjustments.
It is possible that this week USD/CAD movement will remain limited, as market participants await August labor market data on Friday at 14:30 (GMT+2), along with developments in the legal proceedings surrounding higher trade tariffs initiated by the White House. If the labor market shows further weakness (with forecasts pointing to unemployment rising to 4.3% and only modest job gains of 74,000), expectations for monetary easing will strengthen further. This could be reinforced by a partial rollback of tariffs introduced by President Donald Trump since April. On Friday, a U.S. appeals court ruled that most of the current tariffs are illegal, as only Congress has the authority to impose them. As a result, most “retaliatory” tariffs, excluding sector-specific ones, may be removed. The White House has until October 14 to appeal, but the possibility of reduced tariff pressure remains. This would lower consumer price growth risks, one of the key conditions for monetary policy easing.
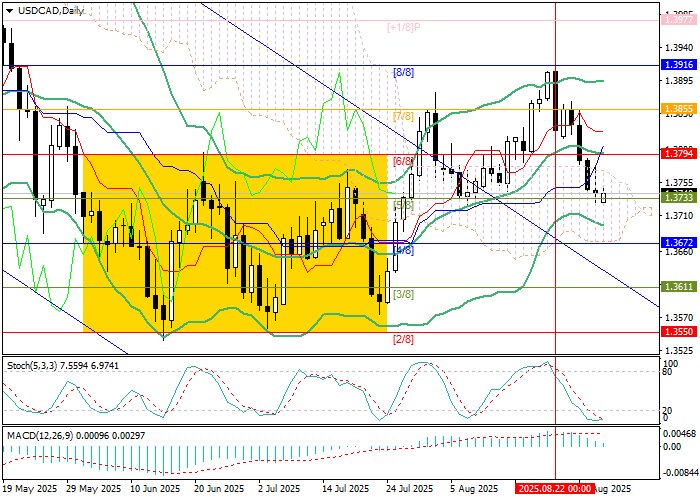
Support and resistance levels
The instrument is testing 1.3733 (Murray level [5/8]); consolidation below this level will open the way to 1.3611 (Murray level [3/8]) and 1.3550 (Murray level [2/8]). A breakout above 1.3794 (Murray level [6/8]), reinforced by the middle Bollinger Band, may trigger growth towards 1.3855 (Murray level [7/8]) and 1.3916 (Murray level [8/8]).
Technical indicators show mixed signals: Bollinger Bands are turning downward, MACD is preparing to move into the negative zone, while the Stochastic may soon exit oversold territory.
Resistance levels: 1.3794, 1.3855, 1.3916.
Support levels: 1.3733, 1.3611, 1.3550.
Trading scenarios
Short positions may be opened below 1.3733 with targets at 1.3611 and 1.3550, and stop-loss at 1.3785. Implementation timeframe: 5–7 days.
Long positions may be opened above 1.3794 with targets at 1.3855 and 1.3916, and stop-loss at 1.3745.
Scenario
Timeframe: Weekly
Recommendations: SELL STOP
Entry point: 1.3730
Take Profit: 1.3611, 1.3550
Stop Loss: 1.3785
Key levels: 1.3550, 1.3611, 1.3733, 1.3794, 1.3855, 1.3916
Alternative scenario
Recommendations: BUY STOP
Entry point: 1.3795
Take Profit: 1.3855, 1.3916
Stop Loss: 1.3745
Key levels: 1.3550, 1.3611, 1.3733, 1.3794, 1.3855, 1.3916