

In September, Canada’s employment data showed a strong recovery: the number of employed increased by 60.4K after a drop of –65.5K in August, far exceeding the forecast of +5K. The unemployment rate held steady at 7.1%, better than the expected 7.2%, while average hourly wages rose by 3.6%. The labor force participation rate edged higher from 65.1% to 65.2%. Given this positive data, the Bank of Canada may maintain a “dovish” stance for the rest of the year, following its unanimous decision in September to cut the key rate by 25 basis points to 2.5% — the lowest in three years. Since June 2024, the cumulative rate change totals –225 basis points.
In the U.S., the government shutdown continues. On Friday, the administration of President Donald Trump announced the dismissal of over 4,000 federal employees, sparking sharp criticism from labor unions. Republican representatives have accused the Democratic minority of blocking the temporary funding bill, which failed to pass by only five votes. Additional pressure on the U.S. dollar came from the University of Michigan Consumer Sentiment Index, which declined slightly from 55.1 to 55.0 in October, though still above the forecast of 54.2. Investors now await the release of the FOMC September meeting minutes. The Federal Reserve previously cut rates by 25 basis points to 4.25%, though policymakers were divided on the outlook. Ten out of nineteen officials favored two more cuts before year-end, citing cooling labor market risks, while others preferred a cautious approach.
Support and Resistance Levels
On the daily chart, Bollinger Bands are slightly rising with a narrowing range, reflecting mixed short-term sentiment. The MACD indicator is attempting to turn downward, forming a potential sell signal as its histogram nears the signal line. Meanwhile, the Stochastic oscillator has flattened near the “80” level, indicating overbought conditions for the U.S. dollar in the very short term.
Resistance levels: 1.4020, 1.4050, 1.4100, 1.4145.
Support levels: 1.3985, 1.3958, 1.3930, 1.3889.
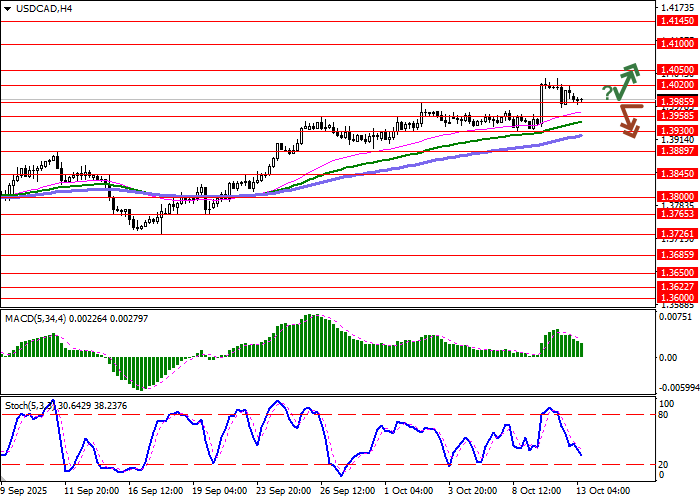 USD/CAD Trading Scenarios and Outlook
Short positions can be opened after a breakout below 1.3985 with a target at 1.3889. Stop loss — 1.4020. Implementation period: 1–2 days.
Long positions can be opened after a rebound from 1.3985 and a breakout above 1.4020 with a target at 1.4100. Stop loss — 1.3985.
Scenario
| Timeframe | Intraday |
| Recommendation | SELL STOP |
| Entry Point | 1.3980 |
| Take Profit | 1.3889 |
| Stop Loss | 1.4020 |
| Key Levels | 1.3889, 1.3930, 1.3958, 1.3985, 1.4020, 1.4050, 1.4100, 1.4145 |
Alternative Scenario
| Recommendation | BUY STOP |
| Entry Point | 1.4025 |
| Take Profit | 1.4100 |
| Stop Loss | 1.3985 |
| Key Levels | 1.3889, 1.3930, 1.3958, 1.3985, 1.4020, 1.4050, 1.4100, 1.4145 |