

Crude oil prices remain under pressure following the OPEC+ decision to increase oil output by 137,000 barrels per day from October — equivalent to about 1.4 million barrels per day in 2026, according to the International Energy Agency (IEA) — leading to market oversupply. As Canada is a major energy exporter, the 12% drop in WTI Crude Oil prices over the past three weeks has weakened its currency. Meanwhile, according to official White House data, U.S. tariff revenues have reached a record $195 billion this year, up fivefold since 2018. At the current pace, the figure could surpass $350 billion next year, providing steady support for the U.S. dollar as a safe-haven asset.
The long-term trend remains bullish: last week, the pair broke above resistance at 1.4015 and is now targeting 1.4163, 1.4277, and 1.4400. A pullback and reversal around 1.4015 would favor new long positions toward 1.4163; otherwise, a correction toward 1.3870 may follow. The trend boundary has shifted to 1.3730. The price is above both the 21-period and 190-period EMAs, indicating short- and long-term bullish momentum. However, the RSI (14) is approaching the overbought zone, suggesting traders should be cautious with new buys.
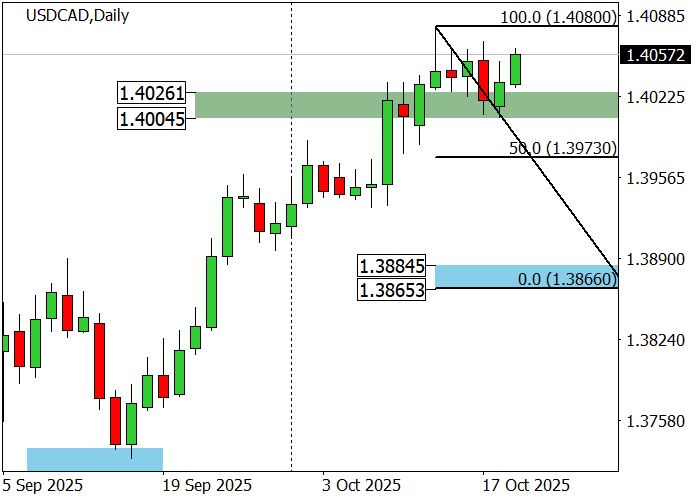
The medium-term trend also remains upward: last week, the instrument broke through zone 2 (1.4026–1.4004) and entered zone 3 (1.4223–1.4203). If a correction develops, a test of key trend support at 1.3884–1.3865 is possible, followed by a rebound toward 1.3973 and 1.4080. If the price breaks above zone 3 within the uptrend, the next target will be zone 4 (1.4428–1.4408). Conversely, a break below support would signal a shift to a bearish trend targeting 1.3694–1.3675.
Support and Resistance Levels
Resistance levels: 1.4163, 1.4277, 1.4400.
Support levels: 1.4015, 1.3730, 1.3554.
USD/CAD Trading Scenarios and Forecast
Long positions may be opened from 1.4015 with a target at 1.4163 and a stop-loss at 1.3965. Implementation period: 9–12 days.
Short positions may be opened below 1.3965 with a target at 1.3870 and a stop-loss at 1.4010.
Scenario
| Timeframe | Weekly |
| Recommendation | BUY LIMIT |
| Entry Point | 1.4015 |
| Take Profit | 1.4163 |
| Stop Loss | 1.3965 |
| Key Levels | 1.3554, 1.3730, 1.4015, 1.4163, 1.4277, 1.4400 |
Alternative Scenario
| Recommendation | SELL STOP |
| Entry Point | 1.3960 |
| Take Profit | 1.3870 |
| Stop Loss | 1.4010 |
| Key Levels | 1.3554, 1.3730, 1.4015, 1.4163, 1.4277, 1.4400 |