
Experts are assessing the latest U.S. Consumer Price Index report, which showed annual inflation accelerating from 2.9% to 3.0% in September, slightly below forecasts of 3.1%, and monthly inflation easing from 0.4% to 0.3% (vs. expectations of no change). Core inflation slowed from 3.1% to 3.0% year-over-year and from 0.3% to 0.2% month-over-month, reinforcing the Federal Reserve’s dovish outlook.
In Canada, primary housing market data indicated that new home prices fell slightly, with the index moving from –1.7% to –1.8% year-over-year and from –0.3% to –0.2% month-over-month, in line with expectations.
Support and Resistance Levels
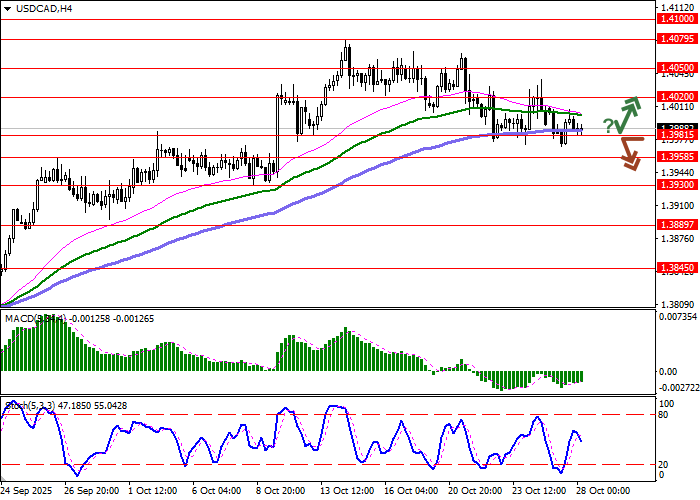
On the daily chart, Bollinger Bands are turning downward, with a slight expansion of the price range that limits downside potential in the very short term. MACD is declining, maintaining a sell signal as the histogram remains below the signal line, while the Stochastic oscillator shows oversold risks for the U.S. dollar.
Resistance levels: 1.4020, 1.4050, 1.4079, 1.4100.
Support levels: 1.3981, 1.3958, 1.3930, 1.3889.
Trading Scenarios and USD/CAD Forecast
Short positions may be considered after a breakout below 1.3981 with a target at 1.3930. Stop-loss: 1.4000. Expected duration: 2–3 days.
Long positions could be opened after a rebound from 1.3981 and a breakout above 1.4020, targeting 1.4079. Stop-loss: 1.3990.
Scenario
| Timeframe | Intraday |
| Recommendation | SELL STOP |
| Entry Point | 1.3980 |
| Take Profit | 1.3930 |
| Stop Loss | 1.4000 |
| Key Levels | 1.3889, 1.3930, 1.3958, 1.3981, 1.4020, 1.4050, 1.4079, 1.4100 |
Alternative Scenario
| Recommendation | BUY STOP |
| Entry Point | 1.4025 |
| Take Profit | 1.4079 |
| Stop Loss | 1.3990 |
| Key Levels | 1.3889, 1.3930, 1.3958, 1.3981, 1.4020, 1.4050, 1.4079, 1.4100 |