

Representatives of both the Democratic and Republican parties have yet to reach an agreement, though analysts expect the Democratic minority in the Senate to support a short-term government funding bill. Meanwhile, President Donald Trump’s administration continues with previously announced federal employee layoffs. On Tuesday, Treasury Secretary Scott Bessent confirmed the severity of the situation, noting that each week of shutdown shaves 0.1–0.2% off GDP. Additionally, the government is reallocating funds to ensure salaries for military and law enforcement personnel. Later today, at 18:20 (GMT+2), Fed Chair Jerome Powell is scheduled to speak and may shed light on the likelihood of monetary policy easing this year. Investors are already pricing in a 25-basis-point rate cut at the Fed’s October meeting.
In Switzerland, the producer and import price index rose from –0.6% to –0.2% month-on-month in September, in line with forecasts, and stayed at –1.8% year-on-year. The Swiss National Bank (SNB) kept its policy rate at 0.00% last month but signaled it could move into negative territory. The next policy meeting is set for December 11. Meanwhile, the economy is adapting to 39% U.S. tariffs — far higher than the EU’s 15%. In response, the Swiss Federal Council extended the maximum period for partial-unemployment benefits from 18 to 24 months, effective November. The measure aims to cushion the impact of sanctions and prevent layoffs, particularly in the machinery, electrical, metallurgical, and watchmaking industries. This follows a previous extension in mid-2024, when the period was raised from 12 to 18 months due to surging energy prices.
Support and Resistance Levels
On the daily chart, Bollinger Bands are turning sideways, with the upper band slightly expanding and opening a path for bulls toward new highs. The MACD indicator maintains a sell signal, as the histogram remains below the signal line, while the Stochastic has moved to the mid-range, suggesting room for further bearish movement.
Resistance levels: 0.8050, 0.8075, 0.8100, 0.8150.
Support levels: 0.8013, 0.7993, 0.7946, 0.7909.
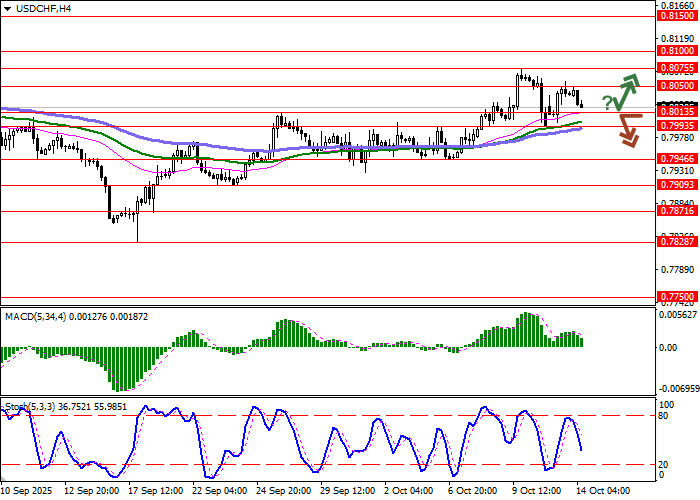
Trading Scenarios and USD/CHF Outlook
Short positions may be opened after a breakout below 0.8013 with a target at 0.7946 and a stop loss at 0.8050. Estimated duration: 1–2 days.
Long positions may be considered after a rebound from 0.8013 and a breakout above 0.8050 with a target at 0.8100 and a stop loss at 0.8020.
Scenario
| Timeframe | Intraday |
| Recommendation | SELL STOP |
| Entry Point | 0.8010 |
| Take Profit | 0.7946 |
| Stop Loss | 0.8050 |
| Key Levels | 0.7909, 0.7946, 0.7993, 0.8013, 0.8050, 0.8075, 0.8100, 0.8150 |
Alternative Scenario
| Recommendation | BUY STOP |
| Entry Point | 0.8050 |
| Take Profit | 0.8100 |
| Stop Loss | 0.8020 |
| Key Levels | 0.7909, 0.7946, 0.7993, 0.8013, 0.8050, 0.8075, 0.8100, 0.8150 |