

Last week, the Fed lowered its benchmark rate by 25 basis points to 4.25% and hinted at the possibility of one or two more cuts before year-end. According to the CME Group’s FedWatch Tool, markets currently price in such scenarios. At the same time, officials raised their growth forecasts for 2025 and 2026. Later today at 14:30 (GMT+2), investors will focus on the final Q2 GDP reading, with the previous estimate pointing to a 3.3% expansion.
In Japan, inflation data from the Tokyo region will be released tomorrow at 01:30 (GMT+2). The core CPI excluding fresh food is expected to accelerate from 2.5% to 2.8% y/y, which may reinforce expectations of tighter monetary policy by the Bank of Japan. Last week, the BoJ kept its rate steady at 0.50%, likely aiming to avoid adding volatility ahead of the country’s prime ministerial elections in October.
Support and Resistance Levels
Bollinger Bands on the daily chart are turning upward, with the price channel widening but lagging behind the recent bullish spike. MACD is climbing, maintaining a relatively firm buy signal (histogram above the signal line). Stochastic shows similar momentum but is now near overbought territory, signaling short-term risks of a pullback in the dollar.
Resistance levels: 148.91, 149.50, 150.00, 150.50.
Support levels: 148.00, 147.50, 146.56, 146.00.
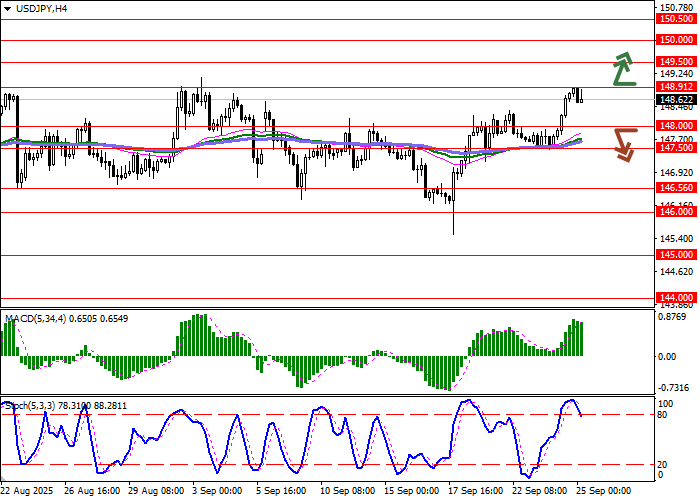
USD/JPY Trading Scenarios and Forecast
Short positions can be considered after a confident break below 148.00 with a target of 146.56. Stop-loss at 148.60. Implementation horizon: 2–3 days.
A return of bullish momentum with a breakout above 148.91 could trigger new long positions targeting 150.00. Stop-loss at 148.40.
Scenario
| Timeframe | Intraday |
| Recommendation | SELL STOP |
| Entry Point | 147.95 |
| Take Profit | 146.56 |
| Stop Loss | 148.60 |
| Key Levels | 146.00, 146.56, 147.50, 148.00, 148.91, 149.50, 150.00, 150.50 |
Alternative Scenario
| Recommendation | BUY STOP |
| Entry Point | 148.95 |
| Take Profit | 150.00 |
| Stop Loss | 148.40 |
| Key Levels | 146.00, 146.56, 147.50, 148.00, 148.91, 149.50, 150.00, 150.50 |