

At the same time, the yen is receiving moderate support from expectations that Japanese monetary authorities will maintain a relatively hawkish stance in 2026 amid a gradual recovery in macroeconomic indicators and living standards. In 2023, the number of households with net assets exceeding ¥500.0 million reached 120.0 thousand, up 30.0% compared with 2021, while the total assets of wealthy and ultra-wealthy households climbed to ¥469.0 trillion. The number of households with wealth above ¥100.0 million rose to a record 1.65 million, driven by higher equity and investment fund valuations amid a weaker yen, increased inheritances, and strong incomes among urban households. While this trend supports economic activity and business models targeting high-income segments, it also deepens economic inequality in the country.
U.S. investors remain focused on key reports and commentary from Federal Reserve officials. Today at 19:30 (GMT+2) and 19:45 (GMT+2), speeches are scheduled from Atlanta Fed President Raphael Bostic and Richmond Fed President Thomas Barkin, who will outline their views on the prospects for interest rate cuts this year—comments that could influence the dollar in the short term. Barkin has already commented on Friday’s labor market data, noting that the delicate balance between moderate job growth and labor supply remains intact, a positive signal suggesting the effectiveness of current monetary policy. Recall that the U.S. economy added 50.0K nonfarm payrolls, below the forecast of 60.0K and revised November figures of 56.0K. At the same time, average hourly earnings accelerated from 3.6% to 3.8% year-on-year and from 0.1% to 0.3% month-on-month, pointing to persistent inflationary pressure, while the unemployment rate fell from 4.6% to 4.4%, beating the forecast of 4.5%. This normalization of indicators reinforces confidence in the resilience of the U.S. labor market and provides a solid фундамент for further dollar strength. December inflation data, due tomorrow at 15:30 (GMT+2), will be critical for near-term price action. According to forecasts, core consumer prices may accelerate from 0.2% to 0.3% month-on-month and from 2.6% to 2.7% year-on-year, potentially reinforcing the Fed’s case for maintaining a pause in its dovish cycle.
Support and Resistance Levels
On the daily chart, Bollinger Bands are attempting to flatten out: the price range is widening, but has yet to fully confirm the recent surge in bullish sentiment. The MACD is rising, forming a new buy signal and attempting to hold above its signal line. The Stochastic oscillator is also moving higher, but remains close to the 80 level, signaling potential overbought risks for the U.S. dollar in the very short term.
Resistance levels: 158.20, 158.50, 159.00, 159.50.
Support levels: 157.88, 157.50, 157.00, 156.43.
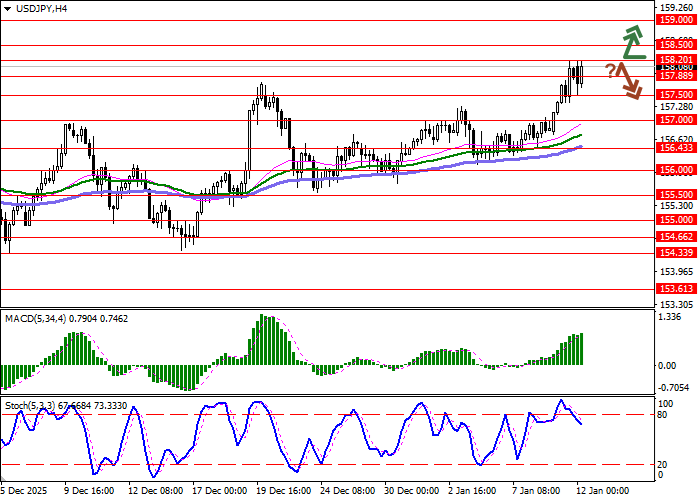
Trading Scenarios and USD/JPY Forecast
Long positions can be considered after a clear breakout above 158.20, targeting 159.00. Stop-loss: 157.80. Time horizon: 1–2 days.
A rebound from 158.20 as resistance followed by a break below 157.88 may serve as a signal to open short positions with a target at 157.00. Stop-loss: 158.20.
Scenario
| Timeframe | Intraday |
| Recommendation | BUY STOP |
| Entry Point | 158.20 |
| Take Profit | 159.00 |
| Stop Loss | 157.80 |
| Key Levels | 156.43, 157.00, 157.50, 157.88, 158.20, 158.50, 159.00, 159.50 |
Alternative Scenario
| Recommendation | SELL STOP |
| Entry Point | 157.85 |
| Take Profit | 157.00 |
| Stop Loss | 158.20 |
| Key Levels | 156.43, 157.00, 157.50, 157.88, 158.20, 158.50, 159.00, 159.50 |
