

According to December data, Japan’s manufacturing PMI rose to 50.0 points, reaching the threshold of the “expansion” zone and confirming a recovery in the sector, which had suffered significant losses following higher US trade tariffs. At the same time, the services PMI declined from 53.2 to 51.6 points, while the composite index fell from 52.0 to 51.1 points. Overall, Japan’s economy is gradually recovering amid stable inflation above 2.0%, with wage indexation expected to support price pressures going forward. Representatives of the financial regulator noted that many companies see wage increases as necessary, despite escalating tensions with China, which could pose a new challenge to the fragile economic balance.
Meanwhile, the outlook for US Federal Reserve policy remains less certain. Many analysts believe that officials will refrain from adjusting monetary conditions at the January 29 meeting, given inflation that still exceeds the 2.0% target, a view supported by recent comments from Fed officials. However, rhetoric could shift if December labor market data confirm further weakening. The US nonfarm payrolls report, due on Friday at 15:30 (GMT+2), is expected to show job growth slowing by 57.0K after 64.0K previously, with private-sector employment seen rising by 50.0K versus 69.0K earlier, while the unemployment rate may edge down from 4.6% to 4.5%.
Support and resistance levels
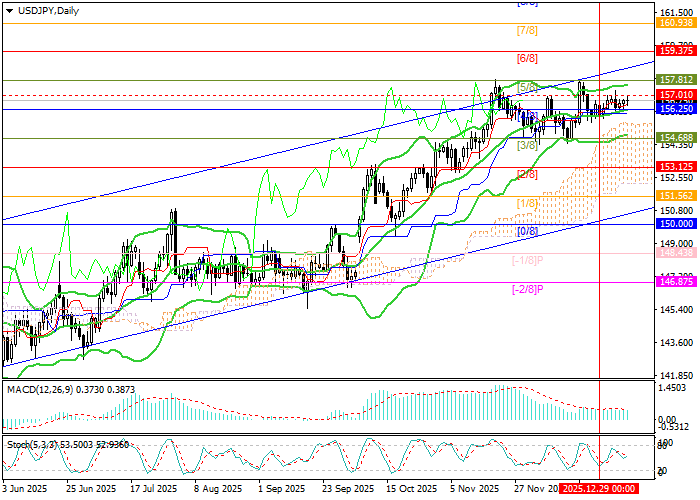
Technically, the pair remains confined within the 157.00–156.25 range. The key level for bulls is seen at 157.81 (Murray level [5/8]), which has been tested twice over the past three months. A sustained breakout above this level would open the way toward 159.37 (Murray level [6/8]) and 160.93 (Murray level [7/8]). For bears, the most important level is 154.68 (Murray level [3/8]), reinforced by the lower Bollinger Band. A break below this area would likely trigger a downward correction toward 151.56 (Murray level [1/8]) and 150.00 (Murray level [0/8]).
Technical indicators point to a potential upside scenario: Bollinger Bands are turning upward, the MACD histogram remains stable in positive territory, and the Stochastic oscillator is moving sideways.
Resistance levels: 157.81, 159.37, 160.93.
Support levels: 154.68, 151.56, 150.00.
Trading scenarios and USD/JPY outlook
Long positions may be opened above 157.81 with targets at 159.37 and 160.93, and a stop-loss at 156.60. Time horizon: 5–7 days.
Short positions may be opened below 154.68 with targets at 151.56 and 150.00, and a stop-loss at 155.00.
Scenario
| Timeframe | Weekly |
| Recommendation | BUY STOP |
| Entry point | 157.85 |
| Take Profit | 159.37, 160.93 |
| Stop Loss | 156.60 |
| Key levels | 150.00, 151.56, 154.68, 157.81, 159.37, 160.93 |
Alternative scenario
| Recommendation | SELL STOP |
| Entry point | 154.65 |
| Take Profit | 151.56, 150.00 |
| Stop Loss | 155.00 |
| Key levels | 150.00, 151.56, 154.68, 157.81, 159.37, 160.93 |
