

Meanwhile, the yen is also influenced by weak macroeconomic indicators. Japan’s industrial production in August fell by 1.6% YoY after a 1.3% drop a month earlier, and by 1.5% MoM after –1.2% previously, while capacity utilization declined from –1.1% to –2.3%. On Tuesday, the International Monetary Fund (IMF) revised Japan’s 2025 GDP growth forecast upward, suggesting that the Bank of Japan could gradually raise borrowing costs toward 1.50% in the medium term from the current 0.50%. In its World Economic Outlook report, the IMF projected that Japan’s GDP will grow by 1.1% in 2025 — up from 0.1% last year and 0.7% previously expected in July — before slowing to 0.6% in 2026, compared to the earlier 0.5% forecast. Rising real wages are expected to support private consumption, offsetting the negative impact of U.S. trade policy uncertainty and weaker external demand. Therefore, the Bank of Japan is likely to continue its gradual normalization path toward a neutral 1.50% policy rate consistent with the 2.0% inflation target.
Additionally, traders are assessing the outcome of Sanae Takaichi’s victory in the Liberal Democratic Party (LDP) leadership election. The parliamentary vote to confirm the new prime minister is expected to take place on October 21 — a date currently under active discussion in the Diet. Analysts, however, remain concerned about the withdrawal of the Komeito party from its coalition with the LDP, which has been in place since 2012, after the parties failed to reach consensus on stricter regulation of corporate and political donations.
Support and Resistance Levels
Bollinger Bands on the daily chart show moderate expansion, with the price range widening but responding weakly to the emerging short-term bearish momentum. The MACD indicator is moving lower, forming a new sell signal (the histogram is below the signal line). The Stochastic oscillator is declining more sharply and approaching the 20.00 level, signaling an increased risk of USD overselling in the near term.
Resistance levels: 151.50, 152.24, 153.00, 153.70.
Support levels: 150.93, 150.50, 150.00, 149.50.
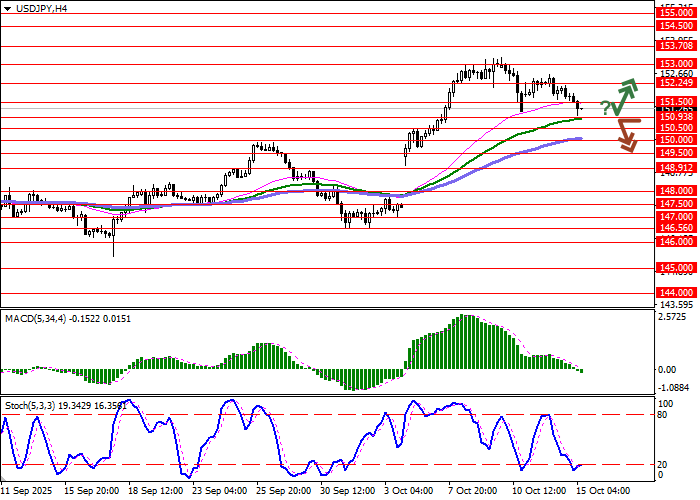
Trading Scenarios and USD/JPY Forecast
Short positions may be opened after a confident breakout below 150.93, targeting 149.50. Stop-loss — 151.50. Expected timeframe: 2–3 days.
A rebound from 150.93 as support followed by a breakout above 151.50 could serve as a signal to open new long positions targeting 153.00. Stop-loss — 150.70.
Primary Scenario
| Timeframe | Intraday |
| Recommendation | SELL STOP |
| Entry Point | 150.90 |
| Take Profit | 149.50 |
| Stop Loss | 151.50 |
| Key Levels | 149.50, 150.00, 150.50, 150.93, 151.50, 152.24, 153.00, 153.70 |
Alternative Scenario
| Recommendation | BUY STOP |
| Entry Point | 151.55 |
| Take Profit | 153.00 |
| Stop Loss | 150.70 |
| Key Levels | 149.50, 150.00, 150.50, 150.93, 151.50, 152.24, 153.00, 153.70 |
---