

Last week, experts at the Organisation for Economic Co-operation and Development (OECD) raised their global growth forecast for this year from 2.9% to 3.2%. For Japan, growth is expected at 1.1% in 2025 and 0.5% in the following year as stimulus effects fade. The report also highlighted that higher U.S. tariffs are weighing on global trade and investment: U.S. imports have fallen for five consecutive months, while Japan’s trade surplus with the U.S. shrank by 50.5% YoY in 2025. Auto exports were hit the hardest (–9.5% in August), with their value down 28.4% compared to 2024. During negotiations, Tokyo and Washington agreed on a 15.0% vehicle tax — well above the previous 2.5%, but below the 30.0–35.0% initially proposed by U.S. President Donald Trump.
Meanwhile, the August personal consumption expenditure (PCE) price index rose 0.3% MoM and 2.7% YoY, while the core measure excluding food and energy came in at 0.2% and 2.9%, respectively. These results met analysts’ expectations but exceeded the Fed’s 2.0% target. The revised estimate of real GDP for Q2 showed growth of 3.8% YoY, reducing the likelihood of imminent monetary easing.
Thus, slowing inflation momentum in Tokyo, the OECD’s updated forecasts, and U.S. trade policy pressure on Japanese exports form a complex mix of risks that the Bank of Japan and investors will weigh in the coming weeks.
Support and Resistance Levels
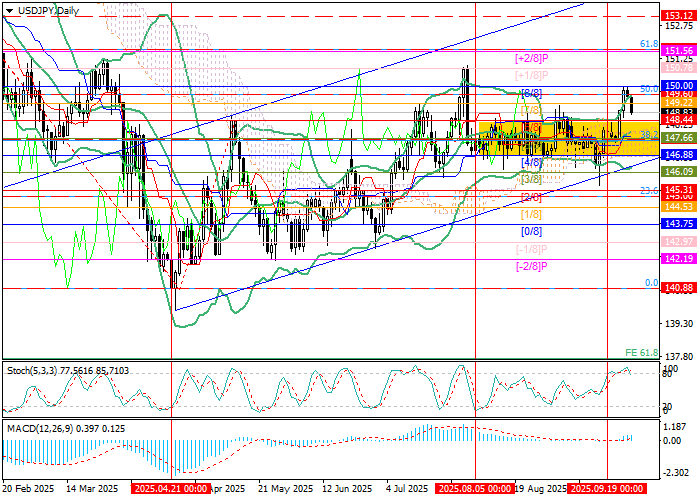
Last week the instrument broke out of its mid-term sideways range of 148.44–146.88 and tested 150.00 (Murray level [8/8]). A breakout and consolidation above this level could open the way toward 151.56 (Murray [+2/8], Fibonacci 61.8% retracement) and 153.12 (Murray [5/8], W1). Conversely, a downward breakout below 148.44 (Murray [6/8]) would return the pair to its sideways channel with targets at 146.88 (Murray [4/8]) and 145.00 (Fibonacci 23.6%).
Technical indicators remain mixed: Bollinger Bands are turning upward, the MACD histogram is expanding in positive territory, while the Stochastic oscillator is preparing to exit the overbought zone.
Resistance levels: 150.00, 151.56, 153.12.
Support levels: 148.44, 146.88, 145.00.
Trading Scenarios and USD/JPY Outlook
Short positions can be opened below 148.44 with targets at 146.88 and 145.00, and a stop-loss at 149.60. Implementation period: 5–7 days.
Long positions can be opened above 150.00 with targets at 151.56 and 153.12, and a stop-loss at 148.90.
Scenario
| Timeframe | Weekly |
| Recommendation | SELL STOP |
| Entry Point | 148.40 |
| Take Profit | 146.88, 145.00 |
| Stop Loss | 149.60 |
| Key Levels | 145.00, 146.88, 148.44, 150.00, 151.56, 153.12 |
Alternative Scenario
| Recommendation | BUY STOP |
| Entry Point | 150.00 |
| Take Profit | 151.56, 153.12 |
| Stop Loss | 148.90 |
| Key Levels | 145.00, 146.88, 148.44, 150.00, 151.56, 153.12 |