

In October, Turkey’s Consumer Price Index slowed from 33.29% to 32.87% year-over-year and from 3.23% to 2.55% month-over-month, beating forecasts of 33.20% and 2.83%, respectively. Finance Minister Mehmet Şimşek noted that inflation, which reached 64–65% at the end of 2022 and 2023, has been steadily declining amid favorable global and domestic conditions. This improvement is already reflected in food, healthcare, telecommunications, education, and tourism, while transportation, alcohol, and tobacco prices have risen. The data confirm a disinflationary trend despite mixed sectoral pressures. Meanwhile, Central Bank of Turkey minutes highlight persistently high inflation expectations: households forecast a 54.1% rise over the next year, while 27.6% expect a reversal. Producer prices in October increased by 1.63% month-on-month, 25.67% since December 2024, and 27.0% year-over-year. Growth slowed in healthcare, telecommunications, education, and hospitality services, but transportation and alcohol/tobacco costs climbed further, reinforcing the uneven disinflation dynamic.
In contrast, U.S. industrial production continued to contract for the eighth consecutive month in October. According to Bloomberg, the slowdown stems from weaker consumer demand and a broader deterioration in economic conditions. The ISM Manufacturing Index fell by 0.4 points to 48.7—below the 50.0 threshold that separates expansion from contraction. The steepest declines were recorded in textiles, apparel, and furniture, while the raw material price index dropped to 58.0, its lowest since the beginning of the year.
Overall, these trends signal a gradual cooling of the global economy. Despite Turkey’s steady disinflation, persistent inflation expectations and weakening external demand limit the lira’s upside potential, requiring a cautious stance from monetary authorities when adjusting policy parameters.
Support and Resistance Levels
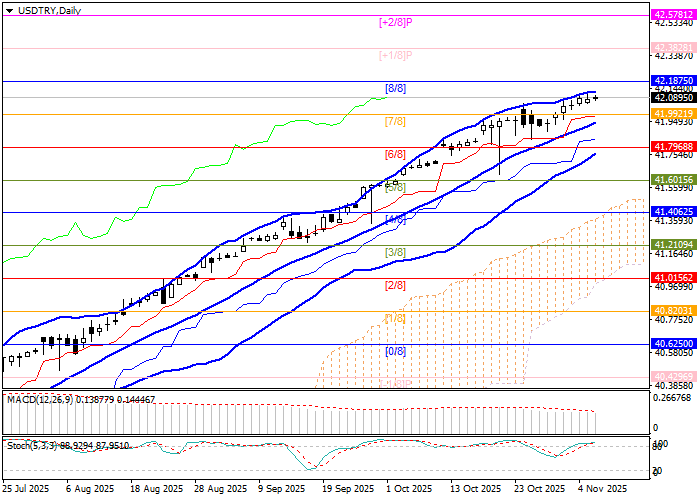
The pair continues to climb within a long-term uptrend, steadily renewing multi-year highs. The price is now near 42.1875 (Murray level [8/8]); a breakout above it would open the way toward 42.3828 ([+1/8]) and 42.5781 ([+2/8]). For bears, the key support lies at 41.7968 ([6/8]), reinforced by the lower Bollinger Band. A break below this level could trigger a decline toward 41.4062 ([4/8]) and 41.2109 ([3/8]), though this scenario remains less likely for now.
Technical indicators suggest a continuation of the upward movement: Bollinger Bands are turning higher, MACD remains in the positive zone, and Stochastic stays flat in the overbought area.
Resistance levels: 42.1875, 42.3828, 42.5781.
Support levels: 41.7968, 41.4062, 41.2109.
Trading Scenarios and USD/TRY Forecast
Long positions can be opened above 42.1875 with targets at 42.3828 and 42.5781, and a stop-loss at 42.0300. Implementation period: 5–7 days. Short positions may be considered below 41.7968 with targets at 41.4062 and 41.2109, and a stop-loss at 41.9400.
Scenario
| Timeframe | Weekly |
| Recommendation | BUY STOP |
| Entry Point | 42.1875 |
| Take Profit | 42.3828, 42.5781 |
| Stop Loss | 42.0300 |
| Key Levels | 41.2109, 41.4062, 41.7968, 42.1875, 42.3828, 42.5781 |
Alternative Scenario
| Recommendation | SELL STOP |
| Entry Point | 41.7965 |
| Take Profit | 41.4062, 41.2109 |
| Stop Loss | 41.9400 |
| Key Levels | 41.2109, 41.4062, 41.7968, 42.1875, 42.3828, 42.5781 |