

Most members of the Federal Open Market Committee (FOMC) have adopted a dovish stance following signs of labor market cooling and slowing inflation. According to the CME FedWatch Tool, the probability of a 25-basis-point rate cut in October stands at 95%, with another similar move expected in December. A deeper cut cannot be ruled out, but updated labor data are unavailable due to the ongoing U.S. government shutdown. Lawmakers in Congress remain deadlocked over the federal budget, and earlier this week, the Senate failed to approve temporary funding through November. Analysts expect growing pressure from President Donald Trump’s administration, which has previously warned of potential mass layoffs if the impasse persists.
Meanwhile, the Turkish lira remains weighed down by uncertainty surrounding the monetary policy of the Central Bank of the Republic of Türkiye. Analysts believe the regulator may pause its easing cycle after September inflation accelerated: consumer prices rose from 32.95% to 33.29% year-on-year and by 3.3% month-on-month. In September, the benchmark rate was cut by 250 basis points to 40.5%, marking the second consecutive reduction. The central bank still expects inflation to slow to 28.5% in 2025 and 16.0% in 2026. The World Bank recently revised Türkiye’s GDP outlook upward, now forecasting growth of 3.1% in 2025, 3.6% in 2026, and 4.2% in 2027, reflecting resilience despite domestic and global challenges.
Support and Resistance Levels
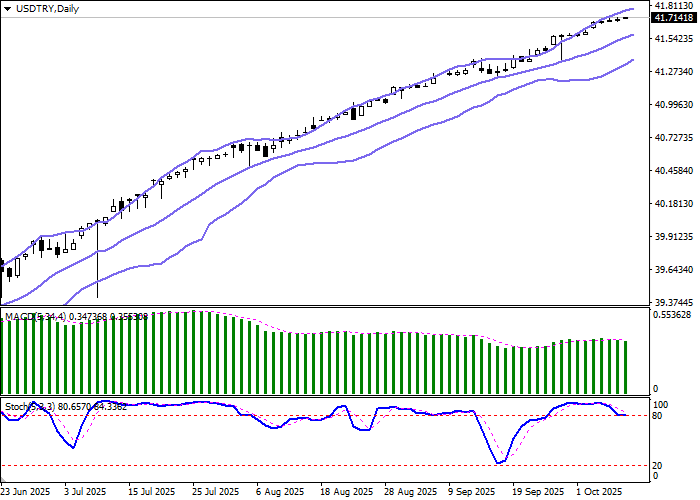
On the daily chart, Bollinger Bands show a steady upward trend, though the price range is slightly narrowing, reflecting mixed short-term sentiment. The MACD indicator is turning downward, forming a sell signal (the histogram is approaching the signal line from above), while the Stochastic oscillator is moving horizontally near the 80 mark, signaling overbought risks for the U.S. dollar in the very short term.
Resistance levels: 41.7252, 41.7800, 41.8300, 41.9000.
Support levels: 41.6673, 41.6000, 41.5000, 41.4000.
Trading Scenarios and USD/TRY Forecast
Long positions may be opened after a breakout above 41.7252 with a target at 41.8300. Stop-loss — 41.6673. Implementation period: 2–3 days.
Short positions may be opened after a rebound from 41.7252 and a breakout below 41.6673 with a target at 41.5500. Stop-loss — 41.7252.
Scenario
| Timeframe | Intraday |
| Recommendation | BUY STOP |
| Entry Point | 41.7255 |
| Take Profit | 41.8300 |
| Stop Loss | 41.6673 |
| Key Levels | 41.4000, 41.5000, 41.6000, 41.6673, 41.7252, 41.7800, 41.8300, 41.9000 |
Alternative Scenario
| Recommendation | SELL STOP |
| Entry Point | 41.6670 |
| Take Profit | 41.5500 |
| Stop Loss | 41.7252 |
| Key Levels | 41.4000, 41.5000, 41.6000, 41.6673, 41.7252, 41.7800, 41.8300, 41.9000 |