

Japan’s Economic Revitalization Minister Ryosei Akazawa confirmed on Friday that imports to the U.S. will now face a fixed tariff rate of 15.0%. This, he warned, will cause significant losses of resources and capital, hurt industrial competitiveness, and force exporters to either cut prices or face declining sales volumes.
The government also slashed its 2025 export growth projection from 3.6% to 1.2%, and corporate investment forecasts from 3.0% to 1.8%, factoring in the tariff impact on the auto industry and other key export sectors, as well as a more cautious stance by companies toward capital spending.
If tomorrow’s corporate goods price index — a gauge of prices for goods purchased by Japanese corporations — matches expectations of a YoY slowdown from 2.9% to 2.5% and an MoM rebound from –0.2% to 0.2%, it could provide short-term support for the yen.
At 14:30 (GMT+2) today, U.S. inflation data will take center stage. CPI is expected to rise from 2.7% to 2.8% YoY and slow from 0.3% to 0.2% MoM, while core CPI is seen increasing from 2.9% to 3.0% YoY and from 0.2% to 0.3% MoM.
Fed Vice Chair for Supervision Michelle Bowman noted that weak July labor market data — with just 73,000 jobs created versus forecasts of 100,000–109,000, and sharp downward revisions to May and June figures — point to instability in the sector. She suggested there could be up to three rate cuts this year. St. Louis Fed President Alberto Musalem highlighted the slowdown in economic activity and potential risks to employment, while inflation shows signs of picking up — forcing the Fed to determine its primary policy focus.
Support and Resistance Levels
Last week, USD/JPY traded mostly in a sideways range between 146.70 and 147.95. Yesterday, the pair broke above the upper boundary, opening the way toward 149.60 (50.0% Fibonacci retracement) and 151.65 (61.8% Fibonacci retracement).
The 146.70 level remains the key bearish pivot: a break below would signal a move toward 145.00 (23.6% Fibonacci retracement) and 142.80 (July lows), though this is currently seen as less likely.
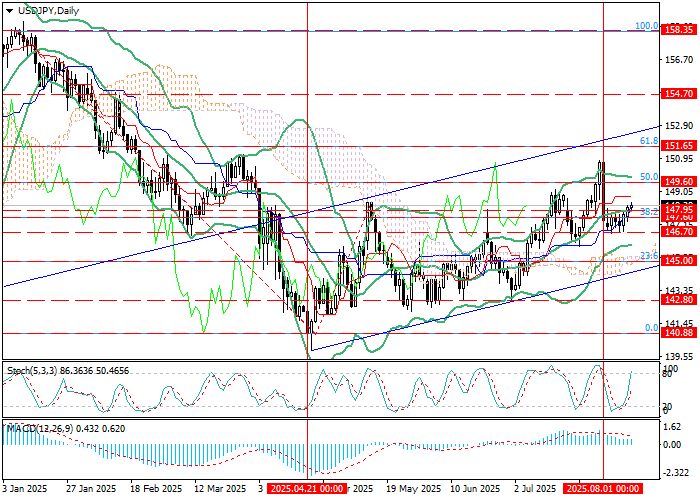
Technical indicators support the bullish bias:
-
Bollinger Bands are flat.
-
Stochastic is pointing higher.
-
MACD is stable in positive territory.
Resistance: 149.60, 151.65
Support: 146.70, 145.00, 142.80
Trading Scenarios
-
-
Entry: 148.50
-
Take Profit: 149.60, 151.65
-
Stop Loss: 147.70
-
Timeframe: 5–7 days
Primary Scenario – Buy Stop:
-
-
-
Entry: 146.65
-
Take Profit: 145.00, 142.80
-
Stop Loss: 147.90
Alternative Scenario – Sell Stop:
-
Key Levels: 142.80, 145.00, 146.70, 149.60, 151.65
