

It is worth noting that the Fed’s official projections remain unchanged, still pointing to only one 25-basis-point rate cut from the current 3.50–3.75% range, whereas market participants are pricing in at least two cuts of the same magnitude. Meanwhile, a key supportive factor for U.S. equities in the current cycle is the manufacturing PMI: in January, the index surged from 47.9 to 52.6, marking its strongest reading in more than three years and indicating a recovery in new orders, production volumes, and other industrial components. Notably, the new orders sub-index rose to 57.1, while the production component advanced to 55.9.
The nomination of Kevin Warsh as the next Fed Chair has also become a pivotal factor in shaping expectations for future monetary policy. The former Federal Reserve Governor is known for criticizing overly accommodative stimulus measures and emphasizing inflation control. Markets reacted to his nomination by pushing long-term U.S. Treasury yields higher, with 10-year notes holding steadily above 4.1–4.2%, increasing the opportunity cost of capital and weighing on equity valuations, particularly in high-multiple sectors. Volatility reflects the debate over whether the Fed under Warsh would maintain higher borrowing costs for longer or shift toward moderate easing while prioritizing price stability.
At the same time, corporate fundamentals remain resilient. Fourth-quarter 2025 earnings reports from index components indicate that profits across technology, industrial, and financial sectors largely met or exceeded analyst consensus estimates, demonstrating the adaptability of corporate business models to the current macroeconomic environment. Domestic revenue growth continues despite a moderate slowdown in hiring, reinforcing the performance of demand-driven companies and supporting earnings stability amid monetary policy uncertainty.
Support and resistance levels
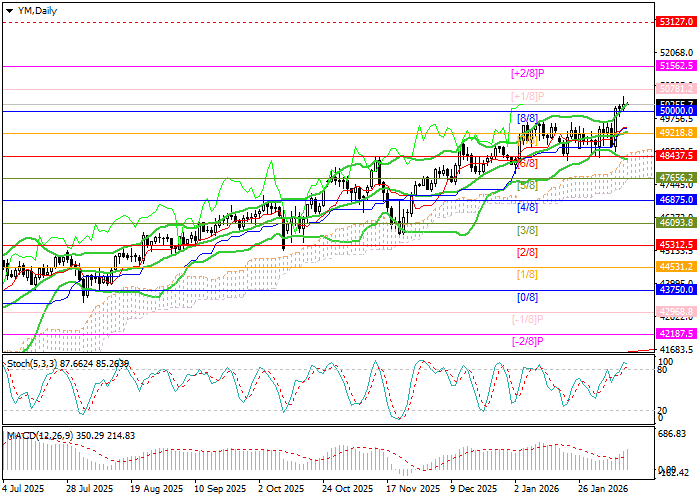
Technically, the index remains within a long-term upward trend, having recently consolidated above the 50,000.0 mark (Murray level [8/8]). The current move targets 51,562.5 (Murray level [+2/8]) and 53,127.0 (Murray level [+2/8], W1). For bears, the key level is 48,437.5 (Murray level [6/8]), reinforced by the lower Bollinger Band. A break below this level could trigger a correction toward 46,875.0 (Murray level [4/8]) and 45,312.5 (Murray level [6/8]).
Technical indicators continue to signal an upward bias: Bollinger Bands are trending higher, the MACD histogram is expanding in positive territory, and the Stochastic oscillator has entered overbought territory. While this does not rule out a corrective pullback, its potential currently appears limited.
Resistance levels: 51,562.5, 53,127.0.
Support levels: 48,437.5, 46,875.0, 45,312.5.
Trading scenarios and DJIA outlook
Long positions may be considered above 50,350.0, targeting 51,562.5 and 53,127.0, with a stop-loss at 49,460.0. Time horizon: 5–7 days.
Short positions may be considered below 48,437.5, targeting 46,875.0 and 45,312.5, with a stop-loss at 49,300.0.
