

At the same time, short-term support for the equity market came from coordinated actions by the U.S. Congress and the Republican administration in the White House, which helped avoid another shutdown of federal agencies. On Tuesday, February 3, Donald Trump signed a package of bills previously approved by the House of Representatives, effectively ending the second shutdown of his current presidential term. The continued operation of government institutions ensured uninterrupted publication of key macroeconomic data, reducing institutional uncertainty and creating a more predictable information environment. Against this backdrop, market participants were able to assess the current state of the economy—particularly the labor market—more objectively, adjusting strategies without additional political pressure. According to December JOLTS data, the number of new job openings in the nonfarm sector declined to 6.542 million from 6.928 million a month earlier, coming in well below market expectations of 7.200 million and marking one of the lowest readings in recent years. At the same time, signs of rising frictional unemployment intensified: initial jobless claims increased from 209.0 thousand to 231.0 thousand, while the total number of benefit recipients rose from 1.819 million to 1.844 million, reinforcing concerns about slowing economic growth in the first half of 2026 and continuing to weigh on U.S. equity performance.
On the previous trading day, market attention was focused on the financial report of U.S. holding Alphabet Inc. Revenue totaled $113.80 billion, exceeding analysts’ expectations of $111.13 billion and the $96.47 billion recorded in the same period a year earlier, while earnings per share came in at $2.82 versus $2.64 and $2.15, respectively.
The active phase of corporate earnings releases noticeably reduced demand for bonds, resulting in only minor changes in yields. Thus, benchmark 10-year Treasuries are trading at 4.182%, slightly below 4.242% at the end of last week; 20-year bonds are yielding 4.785% versus 4.833%, while 30-year bonds stand at 4.846%, down from 4.890% previously.
Among stocks showing gains, The Travelers Co. (+1.72%), Coca-Cola Co. (+1.50%), Cisco Systems Inc. (+1.48%), and Johnson & Johnson (+1.42%) stand out.
The biggest decliners in the index are Microsoft Corp. (–4.95%), Salesforce Inc. (–4.75%), Amazon.com Inc. (–4.42%), and UnitedHealth Group (–2.67%).
Support and resistance levels
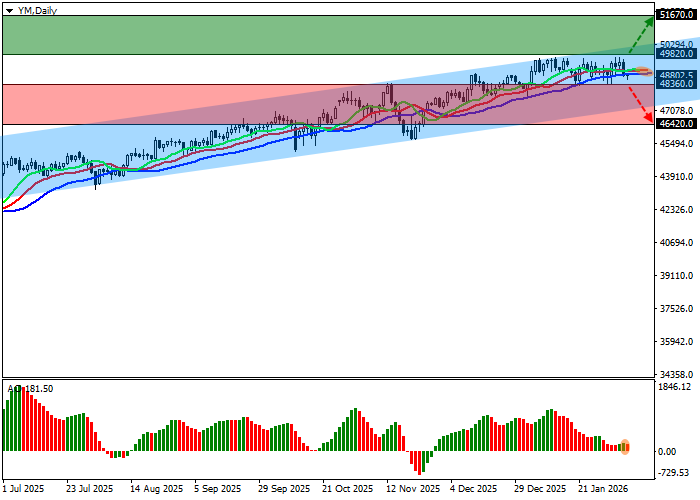
On the daily chart, the instrument’s quotes have returned to upward momentum after a failed attempt to break the annual high at 49,630.0.
Technical indicators are strengthening the buy signal: the EMA range of the Alligator indicator remains fairly wide, while the AO histogram is forming new corrective bars above the zero line.
Support levels: 48,360.0, 46,420.0.
Resistance levels: 49,820.0, 51,670.0.
Trading scenarios and DJIA forecast
Long positions can be opened after the price consolidates above 49,820.0 with a target at 51,670.0 and a stop-loss at 49,200.0. Time horizon: 7 days or more.
Short positions can be opened after the price consolidates below 48,360.0 with a target at 46,420.0. Stop-loss — 49,000.0.
Scenario
| Timeframe | Weekly |
| Recommendation | BUY STOP |
| Entry point | 49,820.5 |
| Take Profit | 51,670.0 |
| Stop Loss | 49,200.0 |
| Key levels | 46,420.0, 48,360.0, 49,820.0, 51,670.0 |
Alternative scenario
| Recommendation | SELL STOP |
| Entry point | 48,359.5 |
| Take Profit | 46,420.0 |
| Stop Loss | 49,000.0 |
| Key levels | 46,420.0, 48,360.0, 49,820.0, 51,670.0 |
