

US equities are correcting as conditions improve across key parts of the domestic economy. Late last week, data showed existing home sales rising from 4.11 million to 4.13 million—its strongest level since February—although it fell short of the 4.15 million forecast. Tomorrow at 15:30 (GMT+2), the US will publish building-permit figures: analysts expect permits to increase from 1.330 million to 1.340 million, while housing starts are projected to rise from 1.307 million to 1.320 million. This could signal a broader recovery in the housing sector, something the market has not seen consistently since the beginning of the year.
As for the outlook on borrowing costs, a major shift in sentiment is unlikely before year-end. November inflation surprised to the downside, and the next decisive catalyst will be December inflation data, which will arrive next year.
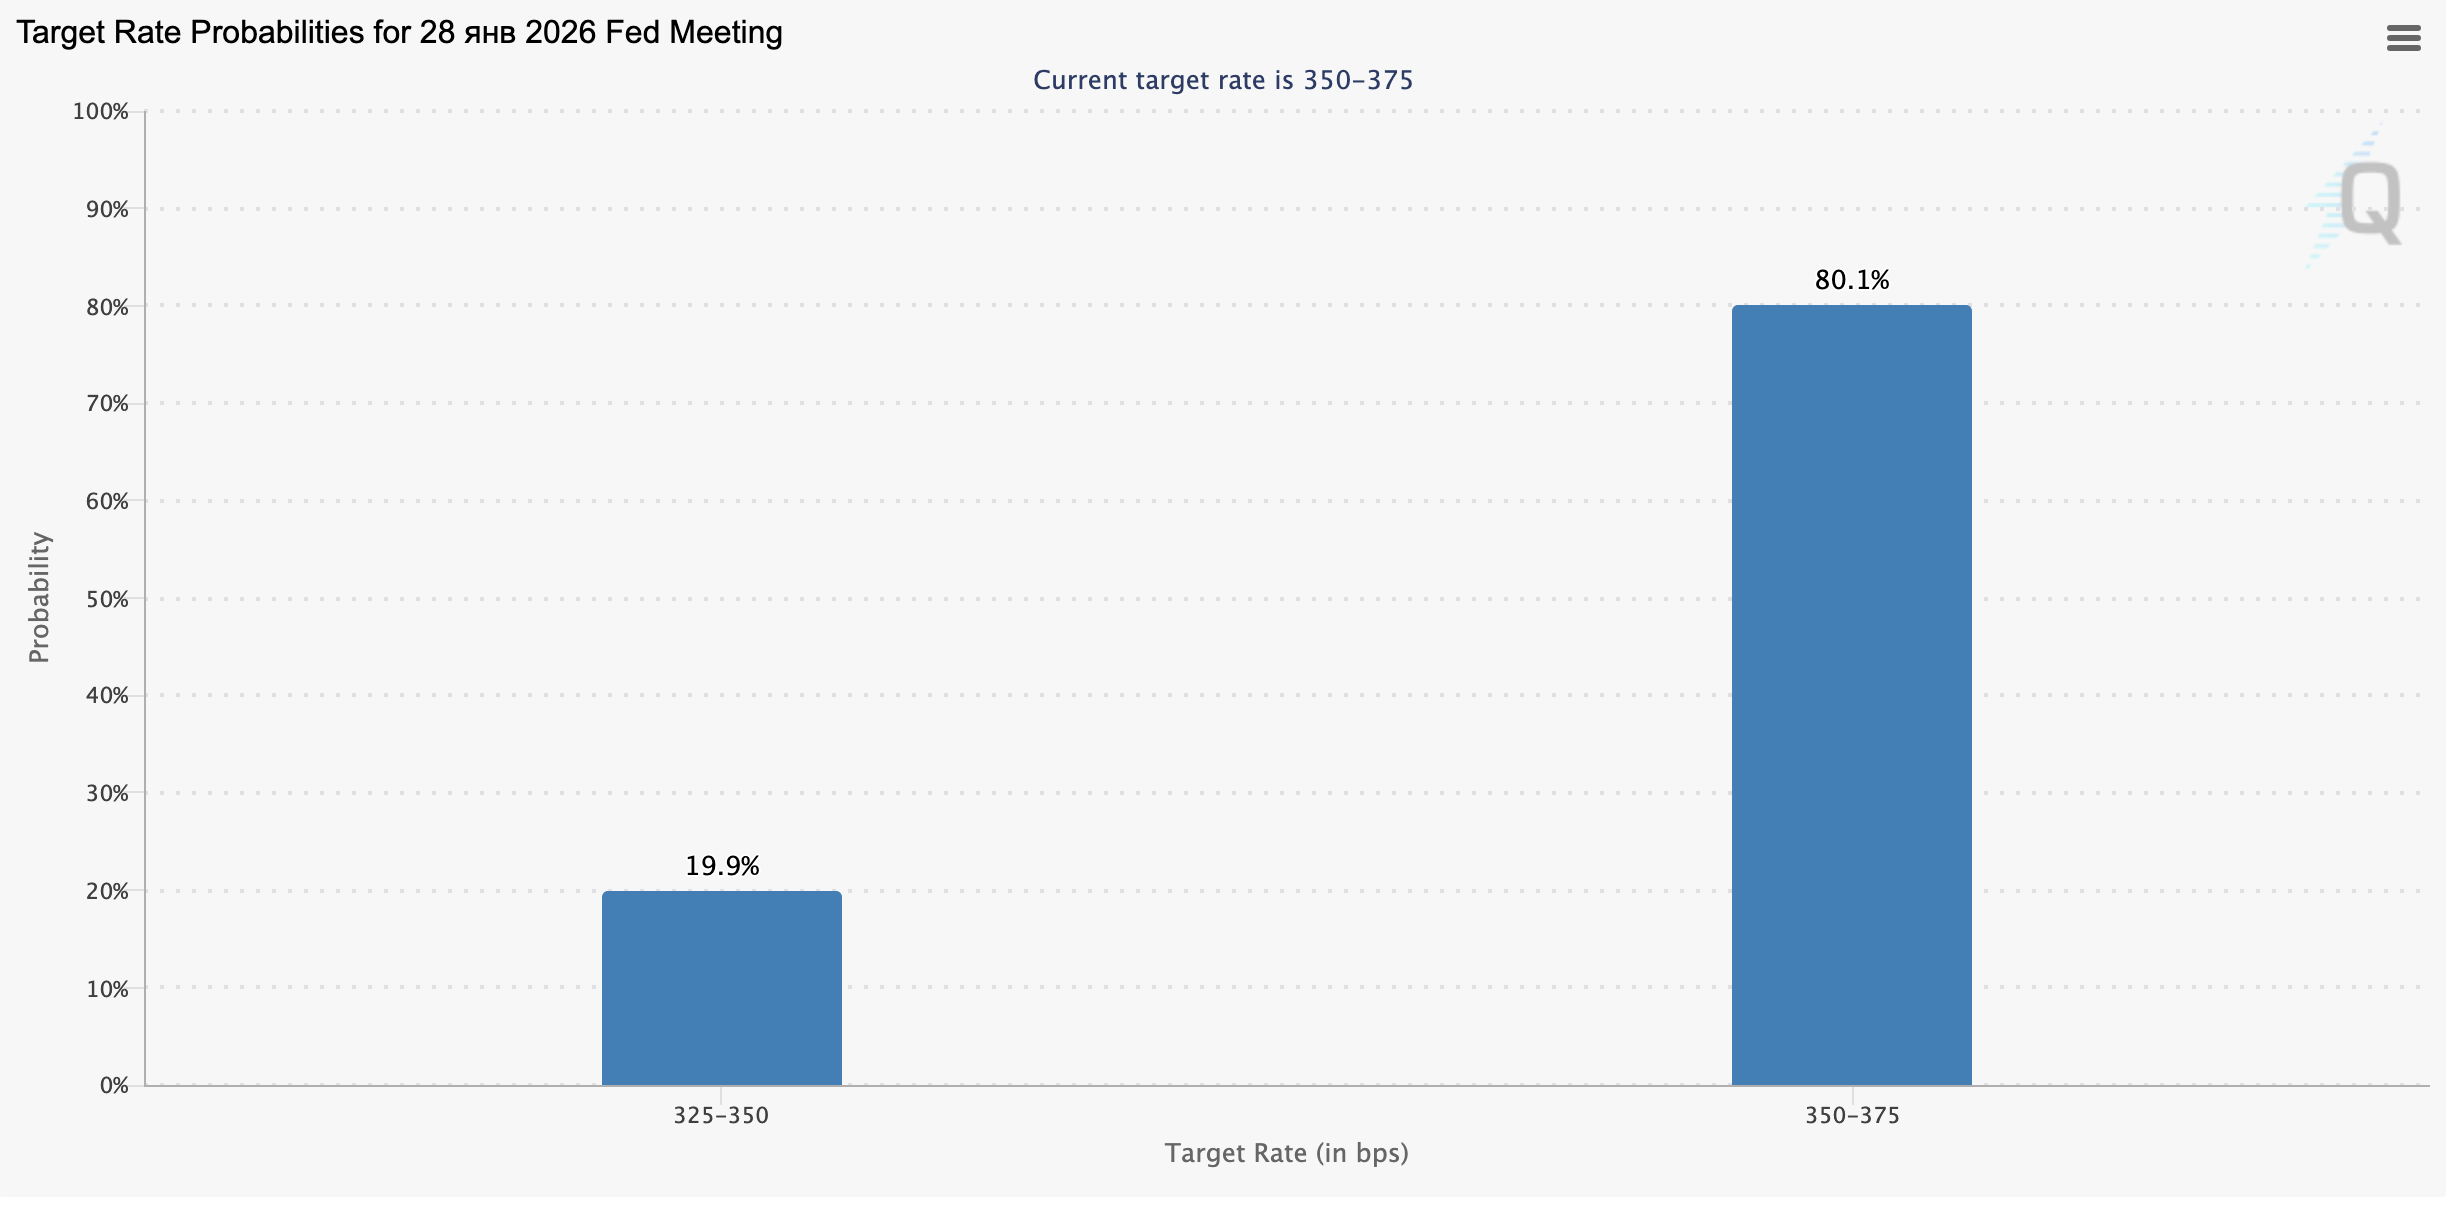
According to the CME Group’s FedWatch Tool, the probability that the Federal Reserve will keep the policy rate unchanged at its late-January meeting stands at 77.9%. The pricing reflects investors’ reaction to cautious remarks from Fed Chair Jerome Powell, who avoided outlining a firm path for next year and emphasized persistent uncertainty amid insufficient progress on inflation.
With the calendar year-end approaching, demand for bonds remains relatively stable, which is pushing yields slightly higher. The 10-year Treasury yield rose to 4.169% from 4.152% at the end of last week; the 20-year yield climbed to 4.805% from 4.781%; and the 30-year yield increased to 4.848% from 4.825%.
The day’s leaders in the index include Nvidia Corp. (+3.93%), The Boeing Co. (+2.79%), Goldman Sachs Group Inc. (+1.96%), and Cisco Systems Inc. (+1.91%).
Among the top decliners are Nike Inc. (–10.54%), Home Depot Inc. (–2.81%), Verizon Communications Inc. (–1.46%), and Sherwin-Williams Co. (–1.38%).
Support and resistance levels
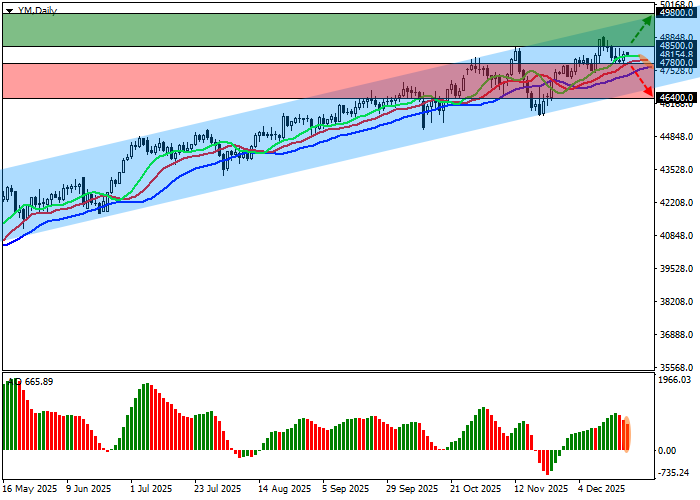
On the daily chart, the index is maintaining a corrective move higher after a failed attempt to break above the yearly high at 48,500.0.
Technical indicators continue to reinforce a stable bullish signal, suggesting the uptrend remains in place. The EMA range on the Alligator indicator remains wide, while the AO histogram is printing new corrective bars above the zero line.
Support levels: 47,800.0, 46,400.0.
Resistance levels: 48,500.0, 49,800.0.
Trading scenarios and DJIA forecast
Scenario 1 (bullish continuation): If the index extends its advance, long positions may be considered after a breakout above 48,500.0, targeting 49,800.0 with a stop-loss at 48,100.0. Time horizon: 7 days or longer.
Scenario 2 (bearish reversal): If the market reverses lower and price consolidates below 47,800.0, short positions may be considered with a target at 46,400.0 and a stop-loss at 48,200.0.
Scenario
| Timeframe | Weekly |
| Recommendation | BUY STOP |
| Entry point | 48,500.5 |
| Take Profit | 49,800.0 |
| Stop Loss | 48,100.0 |
| Key levels | 46,400.0, 47,800.0, 48,500.0, 49,800.0 |
Alternative scenario
| Recommendation | SELL STOP |
| Entry point | 47,799.5 |
| Take Profit | 46,400.0 |
| Stop Loss | 48,200.0 |
| Key levels | 46,400.0, 47,800.0, 48,500.0, 49,800.0 |
