

Recall that in late January, President Donald Trump announced the nomination of Kevin Warsh for the post. Warsh is a consistent critic of the current policy stance of the financial regulator and advocates for large-scale institutional changes, including balance sheet reduction to withdraw excess liquidity, which he believes would create conditions for further cuts in borrowing costs. Notably, arguments in favor of a return to a dovish stance are already emerging. Friday’s inflation data showed that the Consumer Price Index declined from 2.7% to 2.4% year-over-year—the lowest level since May last year—while the monthly figure eased from 0.3% to 0.2%, versus consensus forecasts of 2.5% and 0.3%, respectively. At the same time, the core indicator excluding food and energy prices adjusted from 2.6% to 2.5% year-over-year and from 0.2% to 0.3% month-over-month.
Meanwhile, the labor market is sending mixed signals: in January, nonfarm payrolls increased by 130.0 thousand, exceeding market expectations and driving the unemployment rate down to 4.3%. However, job openings in the private sector came in below forecasts, while revised retrospective data for 2025 point to a slowdown in job creation. Under the current macroeconomic environment, the U.S. equity market continues to show a high correlation with signals from monetary authorities and movements in key economic indicators.
At the end of last week, market participants focused on the financial results of semiconductor materials and equipment supplier Applied Materials Inc., which reported revenue of $7.01 billion—above preliminary estimates of $6.87 billion but slightly below the $7.17 billion recorded in the same period a year earlier. Earnings per share came in at $2.38, compared with $2.21 previously and $2.38 a year ago.
With the active phase of corporate earnings season now complete, demand for bonds has once again become a key driver of yield dynamics. Benchmark 10-year Treasuries are currently trading at 4.029%, slightly below 4.142% at the end of last week, while 20-year and 30-year yields stand at 4.694% and 4.678%, respectively, compared with 4.621% and 4.790% previously.
At present, the top gainers in the index are Nike Inc. (+3.32%), UnitedHealth Group (+3.10%), Walt Disney Co. (+3.00%), and Cisco Systems Inc. (+2.47%).
Among the decliners are Visa Inc. Class A (–3.12%), Apple Inc. (–2.27%), Nvidia Corp. (–2.21%), and 3M Co. (–1.60%).
Support and resistance levels
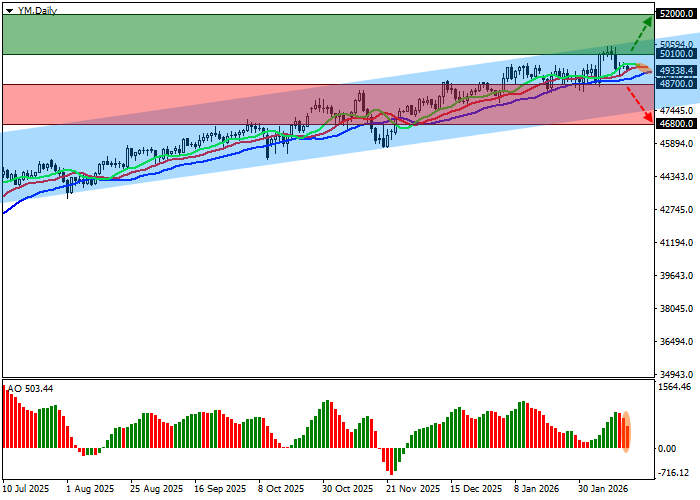
On the daily chart, the instrument is recovering after an unsuccessful attempt to break above the annual high at 50,456.0.
Technical indicators maintain a steady bullish signal: the EMA range on the Alligator indicator remains fairly wide, while the AO histogram is forming new corrective bars above the zero line.
Support levels: 48,700.0, 46,800.0.
Resistance levels: 50,100.0, 52,000.0.
Trading scenarios and DJIA outlook
Long positions can be opened after price consolidation above 50,100.0, with a target at 52,000.0 and a stop-loss at 49,200.0. Time horizon: 7 days or more.
Short positions can be opened after price consolidation below 48,700.0, targeting 46,800.0. Stop-loss: 49,300.0.
Scenario
| Timeframe | Weekly |
| Recommendation | BUY STOP |
| Entry point | 50,100.5 |
| Take Profit | 52,000.0 |
| Stop Loss | 49,200.0 |
| Key levels | 46,800.0, 48,700.0, 50,100.0, 52,000.0 |
Alternative scenario
| Recommendation | SELL STOP |
| Entry point | 48,699.5 |
| Take Profit | 46,800.0 |
| Stop Loss | 49,300.0 |
| Key levels | 46,800.0, 48,700.0, 50,100.0, 52,000.0 |
