

Initial jobless claims declined from 232.0K to 227.0K, confirming overall labor market stability, although absolute levels remain above those typical of a phase of sustained economic expansion. A more notable signal came from the increase in continuing claims to 1.862 million from 1.841 million a week earlier, which may indicate a gradual lengthening of job search durations. In addition, the four-week moving average of initial claims rose from 212.5K to 219.5K, smoothing short-term volatility. At the same time, the unemployment rate fell to 4.3% versus a forecast of 4.4%, employment increased by 130.0K—well above preliminary estimates of 66.0K and December’s 48.0K—and average hourly earnings accelerated from 0.1% to 0.4% against expectations of 0.3%. Overall, the data reinforced expectations that the Federal Reserve will maintain its current monetary policy stance for an extended period, supporting the U.S. dollar, while positive corporate earnings remain the key driver behind S&P 500 resilience.
In particular, Cisco Systems Inc., a manufacturer and supplier of networking equipment for large corporations and telecom companies, reported revenue of $15.3 billion, up from $14.9 billion in the previous quarter and $14.0 billion a year earlier. Earnings per share (EPS) came in at $1.04 versus $1.00 and $0.94, respectively. Meanwhile, wireless carrier T-Mobile US Inc. reported revenue growth to $24.33 billion, exceeding $21.96 billion and $21.87 billion in the prior quarterly and annual periods, respectively, while EPS rose to $2.14 compared with $2.41 and $2.57.
The bond market also reacted to the shifting fundamentals, with yields gradually adjusting. One-year yields stand at 3.464% versus 3.406%, 10-year yields at 4.114% compared with 4.144% at the end of last week, while 20-year and 30-year yields are at 4.693% and 4.746%, down from 4.749% and 4.814%, respectively.
Current gainers within the index include Equinix Inc. (+10.41%), Akamai Technologies Inc. (+10.35%), Zebra Technologies Corp. (+8.57%), and Motorola Solutions Inc. (+7.67%).
Decliners include Baxter International Inc. (–15.99%), Tyler Technologies Inc. (–15.39%), C.H. Robinson Worldwide Inc. (–14.54%), and Expeditors International of Washington Inc. (–13.18%).
Support and resistance levels
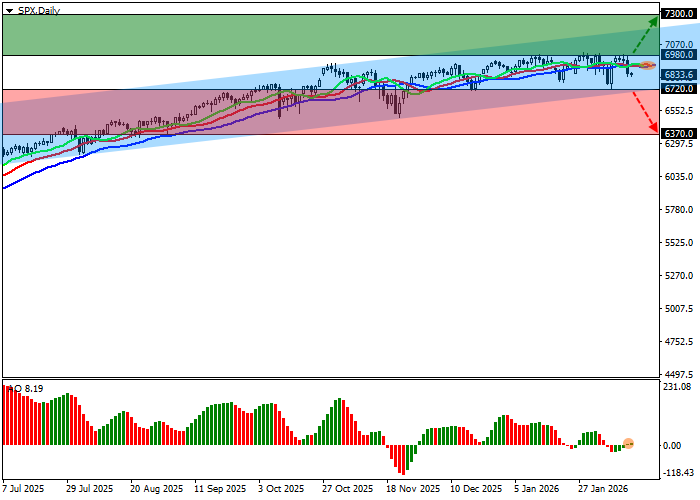
On the daily chart, the index has attempted a rebound while remaining within the 7,300.0–6,800.0 channel.
Technical indicators show an unstable buy signal that has weakened amid the local correction: fast EMAs on the Alligator indicator are approaching the signal line, while the AO histogram, remaining in positive territory, is forming corrective bars.
Support levels: 6,720.0, 6,370.0.
Resistance levels: 6,980.0, 7,300.0.
Trading scenarios and S&P 500 outlook
Long positions can be opened after a confirmed breakout above 6,980.0, targeting 7,300.0. Stop-loss: 6,900.0. Time horizon: 7 days or longer. Short positions can be opened after a confirmed break below 6,720.0, targeting 6,370.0. Stop-loss: 6,850.0.
Scenario
| Timeframe | Weekly |
| Recommendation | BUY STOP |
| Entry point | 6,980.5 |
| Take Profit | 7,300.0 |
| Stop Loss | 6,900.0 |
| Key levels | 6,370.0, 6,720.0, 6,980.0, 7,300.0 |
Alternative scenario
| Recommendation | SELL STOP |
| Entry point | 6,719.5 |
| Take Profit | 6,370.0 |
| Stop Loss | 6,850.0 |
| Key levels | 6,370.0, 6,720.0, 6,980.0, 7,300.0 |
