

In the corporate sector, the main headline was an agreement between specialist finance platform BasePoint Capital and UK-based international financial group International Personal Finance Plc (IPF) at 235.0 pence per share in cash, valuing the company at around £543.0 million. The offer implies a 31.1% premium to IPF’s closing price on 29 July—its last trading day before the offer period began—and a 45.3% premium to the three-month volume-weighted average price. Under the terms of the deal, shareholders will also remain eligible for final dividends for the financial year ending today of up to 9.0 pence, which are expected to be declared on 25 February. IPF’s board unanimously recommends that shareholders approve the transaction, and senior management has already committed to tender its 1.17% stake into the offer. Separately, mining group Anglo American Plc entered into a strategic commercial partnership with Grangex AB to restart the Sydvaranger mine in Kirkenes, northern Norway. The partnership envisages 100.0% ownership access to the mine for Anglo American Plc, which in turn will waive royalties amounting to $37.0 million.
A fairly expected response to the decline in investor activity during the New Year holidays was a downward move in yields across the bond market. Short-dated one-year bonds—more sensitive to local shifts—are trading at 3.568%, well below 3.704% recorded before the weekend; 10-year yields are at 4.488% versus 4.536% last week; 20-year yields have slipped to around 5.119% from 5.173% on Friday; while global 30-year yields have eased to 5.214% from 5.273% previously.
Top gainers in the index include Fresnillo Plc (+5.26%), Intchains Group Ltd. ADR (+4.92%), Airtel Africa Plc (+3.24%), and Antofagasta Plc (+2.43%).
Among the decliners, DCC Plc (–1.92%), Experian Plc (–0.93%), and Metlen Energy & Metals Plc (–0.90%) stand out.
Support and Resistance Levels
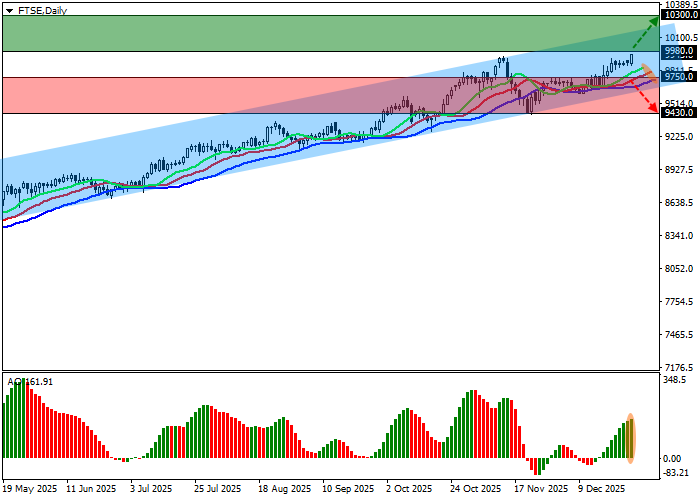
On the four-hour chart, the index is attempting to move closer to the resistance line of the local ascending channel with dynamic boundaries at 10,300.0–9,700.0.
Technical indicators are delivering an unstable buy signal that is strengthening amid the local correction: the EMA range on the Alligator indicator is gradually widening, while the AO oscillator histogram is printing new corrective bars above the zero line.
Support levels: 9,750.0, 9,430.0.
Resistance levels: 9,980.0, 10,300.0.
Trading Scenarios and FTSE 100 Forecast
Long positions can be considered after price consolidates above the 9,980.0 resistance level, targeting 10,300.0, with a stop-loss at 9,850.0. Time horizon: 7 days or more.
Short positions can be considered after a definitive reversal and consolidation below the 9,750.0 support level, targeting 9,430.0. Stop-loss: 9,850.0.
Scenario
| Timeframe | Weekly |
| Recommendation | BUY STOP |
| Entry point | 9,980.0 |
| Take Profit | 10,300.0 |
| Stop Loss | 9,850.0 |
| Key levels | 9,430.0, 9,750.0, 9,980.0, 10,300.0 |
Alternative Scenario
| Recommendation | SELL STOP |
| Entry point | 9,750.0 |
| Take Profit | 9,430.0 |
| Stop Loss | 9,850.0 |
| Key levels | 9,430.0, 9,750.0, 9,980.0, 10,300.0 |
