

Yesterday, the company announced a partnership with AMD Inc., a manufacturer of AI-enabled processors, aimed at creating and developing open-source platforms that will combine quantum computers and high-performance processors capable of detecting and correcting errors in real time.
At the end of October, IBM Corp. will publish financial results for Q3: revenue is expected at $16.08 billion compared to $17.00 billion in the previous quarter and $15.00 billion a year earlier, while earnings per share (EPS) are forecast at $2.44 versus $2.80 and $2.30, respectively.
A dividend payout of $1.68 per share is scheduled for September 10, up from $1.67 last year. The yield may reach about 2.69%, which exceeds the sector average of 0.72%.
Support and resistance levels
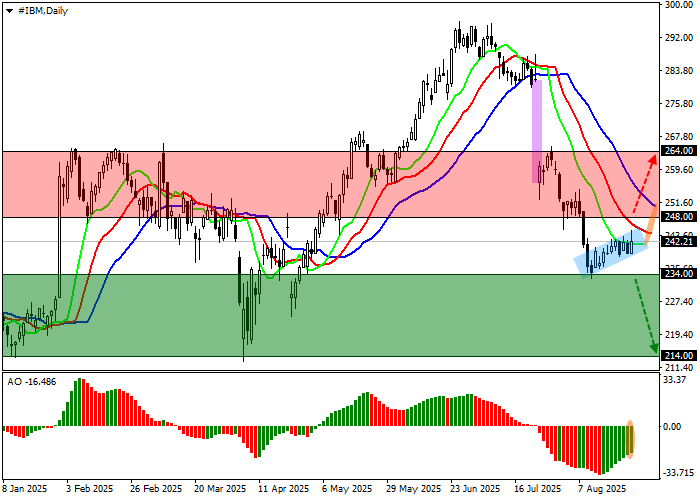
On the daily chart, the price is correcting within a downward trend, trading slightly above the yearly low of 210.00.
Technical indicators show a steady sell signal: the EMA Alligator spread is widening, and the AO histogram is forming corrective bars well below the zero line.
Support levels: 234.00, 214.00.
Resistance levels: 248.00, 264.00.
Trading scenarios
If the price reverses and continues to decline, consolidation below 234.00 will make sell positions relevant with a target of 214.00 and stop-loss at 240.00. Implementation period: 7 days or more.
If growth continues and the price consolidates above 248.00, buy positions will be relevant with a target of 264.00 and stop-loss at 240.00.
Scenario
Timeframe: Weekly
Recommendation: SELL STOP
Entry point: 233.95
Take Profit: 214.00
Stop Loss: 240.00
Key levels: 214.00, 234.00, 248.00, 264.00
Alternative scenario
Recommendation: BUY STOP
Entry point: 248.05
Take Profit: 264.00
Stop Loss: 240.00
Key levels: 214.00, 234.00, 248.00, 264.00