

The key driver behind the current energy crisis is Iran’s effective blockade of the Strait of Hormuz, through which around 20.0% of global hydrocarbon supplies typically pass. The international community has so far failed to produce an effective response: calls by US President Donald Trump to form a naval coalition to secure shipping routes have not gained broad support among key allies. This continues to fuel uncertainty and keeps a geopolitical premium embedded in oil prices, while US gasoline prices have climbed to their highest level in the past 2.5 years, exceeding 3.84 dollars per gallon.
Analysts emphasize that no realistic path to de-escalation is currently visible, meaning crude prices could remain elevated in the 100.00–110.00 range at least through mid-year. Against this backdrop, the White House has officially lifted restrictions on US companies doing business with Venezuela’s state oil firm PDVSA. The new license allows companies that were active before January 2025 to purchase crude and sell it on global markets.
Additionally, President Donald Trump has temporarily suspended the US Merchant Marine Act (Jones Act) for 60 days in order to contain rising transportation costs for oil, natural gas, and related products. The Jones Act, in force since 1920, restricts domestic maritime transport to US-flagged vessels, historically supporting national shipping capacity but also increasing logistics costs compared to global rates. Its temporary suspension effectively opens the domestic market to foreign shipping operators and reduces delivery expenses.
Major investment banks are revising their forecasts for energy prices. Analysts at Citigroup Inc. have raised their short-term target for Brent Crude Oil to 110.00–120.00, estimating that supply disruptions could reach 11.0–16.0 million barrels per day over the next 4–6 weeks. However, even this scenario implies less severe damage than the initially feared complete shutdown of exports through the strait.
Meanwhile, yesterday’s Federal Reserve meeting drew close attention from traders concerned about secondary inflationary effects caused by rising commodity prices. As expected, the regulator kept the interest rate in the 3.50–3.75% range but revised its core inflation projections upward, acknowledging that the crisis is exerting persistent price pressure. The updated dot plot also reflected a shift in policymakers’ expectations: only one rate cut is now anticipated this year, compared to earlier discussions that considered up to three adjustments.
Support and resistance levels
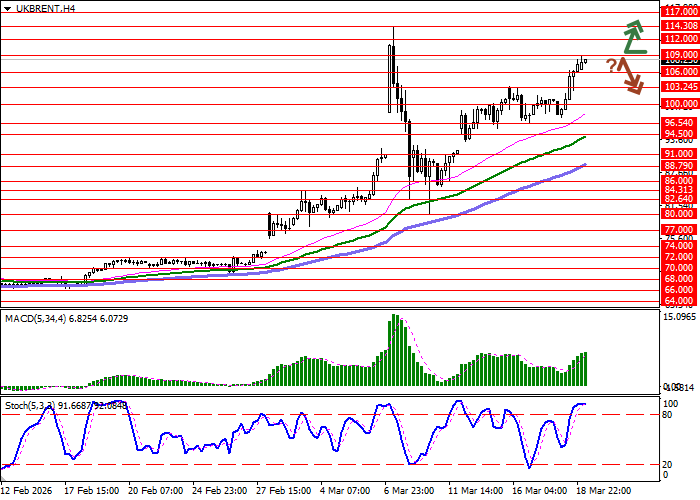
On the daily chart, Bollinger Bands are rising, with the price range expanding and opening the way for bulls toward local highs. The MACD indicator maintains a strong buy signal, with the histogram above the signal line, while Stochastic remains near peak levels, indicating a risk of overbought conditions in the near term.
Resistance levels: 109.00, 112.00, 114.30, 117.00.
Support levels: 106.00, 103.24, 100.00, 96.54.
Trading scenarios and oil price forecast
Long positions can be considered after a breakout above 109.00, targeting 114.30. Stop-loss — 106.00. Timeframe: 1–2 days.
Short positions can be considered after a rebound from 109.00 followed by a breakdown below 106.00, targeting 100.00. Stop-loss — 109.00.
Scenario
| Timeframe | Intraday |
| Recommendation | BUY STOP |
| Entry point | 109.05 |
| Take Profit | 114.30 |
| Stop Loss | 106.00 |
| Key levels | 96.54, 100.00, 103.24, 106.00, 109.00, 112.00, 114.30, 117.00 |
Alternative scenario
| Recommendation | SELL STOP |
| Entry point | 105.95 |
| Take Profit | 100.00 |
| Stop Loss | 109.00 |
| Key levels | 96.54, 100.00, 103.24, 106.00, 109.00, 112.00, 114.30, 117.00 |
