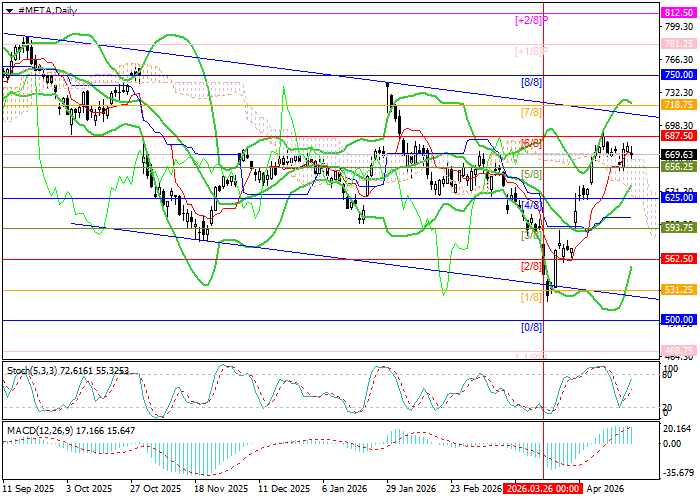
Shares of Meta Platforms Inc., the American multinational holding company that owns a technology conglomerate and the world's largest social network Facebook, are trading within a medium-term downtrend, forming a corresponding descending channel: at the end of last month, the price reached its lower boundary near 531.25 (Murray level [1/8]), but failed to break below it and moved into a correction. The price is currently in the positive zone of the main Murray trading range and has already approached the reversal level of 687.50 (Murray level [6/8]) — a sustained close above which would allow the instrument to break out through the channel's upper boundary and continue toward targets at 750.00 (Murray level [8/8]) and 781.25 (Murray level [+1/8]). The key level for sellers is the midpoint of the main Murray trading range at 625.00 (Murray level [4/8]), reinforced by the Bollinger Bands middle line: a break below it would serve as a catalyst for intensifying bearish momentum and a move toward 562.50 (Murray level [2/8]) and 500.00 (Murray level [0/8]).
Technical indicators leave room for further upside: Bollinger Bands and Stochastic are turning higher, while the MACD histogram remains stable in negative territory.
Support and Resistance Levels
Resistance levels: 687.50, 750.00, 781.25.
Support levels: 625.00, 562.50, 500.00.
Meta Platforms Inc. Trading Scenarios and Forecast
Long positions are worth considering above 687.50, targeting 750.00 and 781.25, with a stop-loss at 640.00. Time horizon: 5–7 days.
Short positions are worth considering below 625.00, targeting 562.50 and 500.00, with a stop-loss at 670.00.
Main Scenario
| Timeframe |
Weekly |
| Recommendation |
BUY STOP |
| Entry Point |
687.55 |
| Take Profit |
750.00, 781.25 |
| Stop Loss |
640.00 |
| Key Levels |
500.00, 562.50, 625.00, 687.50, 750.00, 781.25 |
Alternative Scenario
| Recommendation |
SELL STOP |
| Entry Point |
624.95 |
| Take Profit |
562.50, 500.00 |
| Stop Loss |
670.00 |
| Key Levels |
500.00, 562.50, 625.00, 687.50, 750.00, 781.25 |
Forex Analyst & Educator
Sagar Dua is a financial markets educator specializing in technical and fundamental analysis. With a background in Commerce and experience as an Assistant Professor, he now mentors beginner traders and investors through Forex-focused seminars and webinars, combining academic depth with practical market education